Creating reports and graphics with ITM Platform data in Excel: Basic access using Power Query
ITM Platform can be easily connected with external data analysis tools to produce project reports and graphs, as well as to automate the creation of custom dashboards.
This guide will demonstrate the use of Microsoft Excel 2016, which includes Power Query, to generate such outputs.
Necessary requirements to complete this tutorial:
- Microsoft Excel,
- An ITM Platform active environment
- ITM Platform user with access to the information to be analyzed.
In addition, because the connection to Excel uses the ITM Platform API, it is convenient to have some familiarity with its methods and functions. All documentation is available at http://developers.itmplatform.com/.
Note: The steps described in this guide should only be performed once to configure the connection. From that point Excel will automatically update the data from ITM Platform.
Example
- Projects to be analyzed: All active projects on May 7, 2017
- Objective: To compare the percentage completed versus the updated percentage completed to date reported.
Note: ITM Platform does not automatically calculate the percentage of progress in the calendar (ie, the percentage of time elapsed from the start of the project on the total estimated time for the project). However, this value can be easily calculated with the following formula:
% Calendar = (today – start date) * 100 / (end date – start date)
Step 1 – Identify the methods of ITM Platform’s API
Before you can start, you must identify the methods to be used at http://developers.itmplatform.com/. In this example, the following are used:
First method: Authentication: (get authentication)
http://developers.itmplatform.com/documentation/#authentication-1
In this example, the following access data is used for authentication:
- User: musk@itmplatform.com
- Password: 12345
- Account: itmrozas
The URL is constructed with the following format:
https://api.itmplatform.com/ORGANIZATION/login/USER/PASSWORD
Therefore, in this case it will be:
https://api.itmplatform.com/itmrozas/login/elon.musk@itmplatform.com/12345
Second method: Projects (get projects) http://developers.itmplatform.com/documentation/#projects
This is the method for obtaining the projects data for the complete list of projects.
Step 2 – Create the basic query from Excel
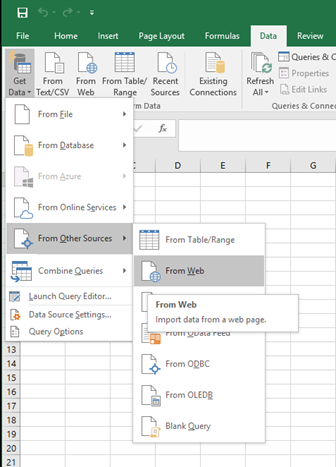
To access Power Query from Excel, simply indicate a data source. In this case, ITM Platform should be selected from the path From Other Sources> From Web.
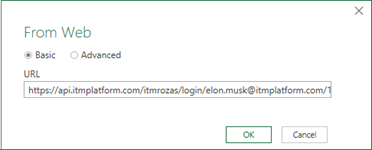
In the box, you must enter the authentication URL, which has the same format as seen above:
https://api.itmplatform.com/ORGANIZACION/login/USER/PASSWORD
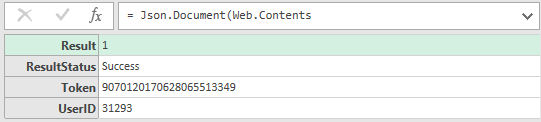
When accepting the source, Excel will provide the authentication data, which includes the authorization token.
Then, from the Power Query Advanced Editor, in the Start menu, you can add the URL of the projects.
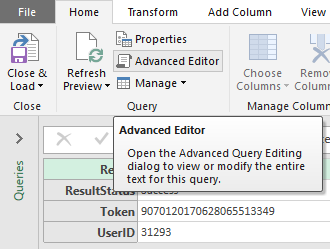
The advanced editor loads the Power Query interface and allows you to add code in the “M” or “Get & Transform” language. Although it is not necessary to know it, the basic keys will be given to be able to handle it successfully.
If all went well, the editor should display the following information:
Let
Source =
Json.Document(Web.Contents(“https://api.itmplatform.com/itmrozas/login/elon.musk@itmplatform.com/12345”))
in
Source
This indicates that the call to the authentication URL is stored in the Source variable. This is the essential element for Excel to be able to synchronize with ITM Platform and extract the data.
Next, you must indicate what data should be extracted. In this case, the project URL is added. In order to only see the projects that are open on May 7, the following search filter is added at the end of the URL:
?ProjectStartDate = lt: 2017-05-08T00: 00: 00Z & ProjectEndDate = gt: 2017-05-06T00: 00: 00Z
With the entire URL resulting in this:
https://api.itmplatform.com/itmrozas/projects/?ProjectStartDate=lt:2017-05-08T00:00:00Z&ProjectEndDate=gt:2017-05-06T00:00:00Z
For Power Query to be able to use authentication and query projects, you must replace the previous code with this:
Let
MyToken = Json.Document (Web.Contents (“https://api.itmplatform.com/itmrozas/login/elon.musk@itmplatform.com/12345”))
Source = Json.Document (Web.Contents (“https://api.itmplatform.com/itmrozas/projects/?ProjectStartDate=lt:2017-05-08T00:00:00Z&ProjectEndDate=gt:2017-05-06T00:00: 00Z”, [Headers = [token = myToken [Token]])))
in
Source
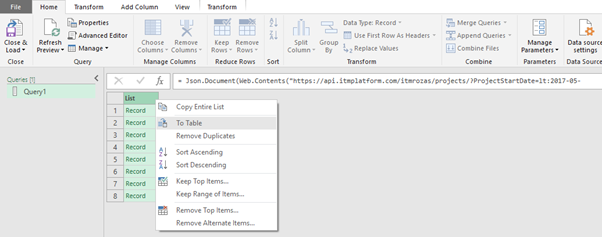
The result of the query shows data that must be transformed into a table. You can activate this option by right clicking.
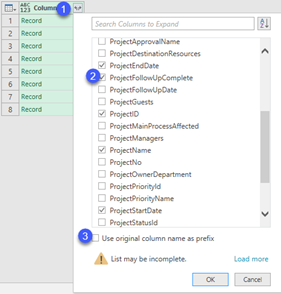
The appropriate columns are then selected.
As calculations are to be performed with the date formula, it is convenient to specify date field format. To do this, select each date field and the date / time / zone option.
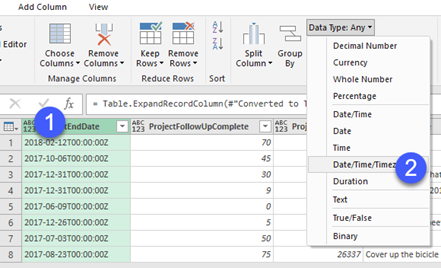
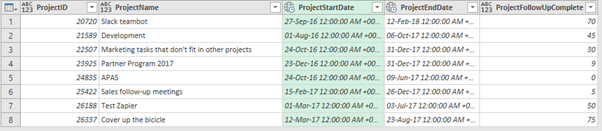
Finally, a list of projects that meet our conditions is produced:

Step 3 – Add the calculated data
It now becomes possible to calculate what we were looking for: the percentage of progress in the calendar. Recall that it is based on the formula:
(Today – date start) * 100 / (end date – start date)
The dialog box already provides everything you need. Just add the current date, which you get with the Power Query function:
DateTimeZone.FixedLocalNow ().
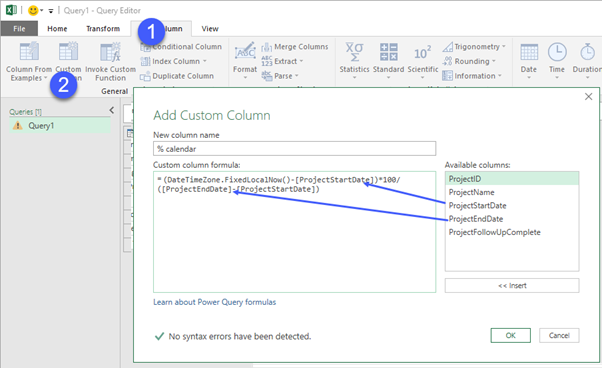
The result is a column in which the data we needed was calculated.
Step 4 – Save and View
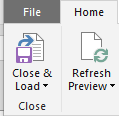
Once the query outputs the calculated data, you can save and close the Power Query file.
To visualize the result, Excel allows access to both the complete table of query data and graphics.
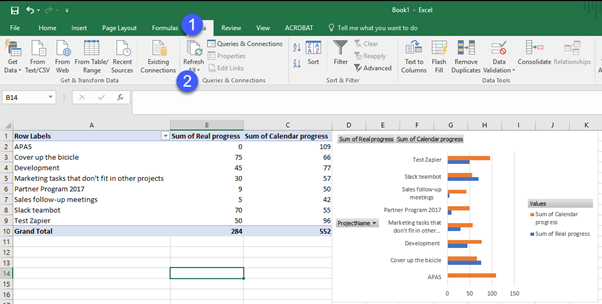
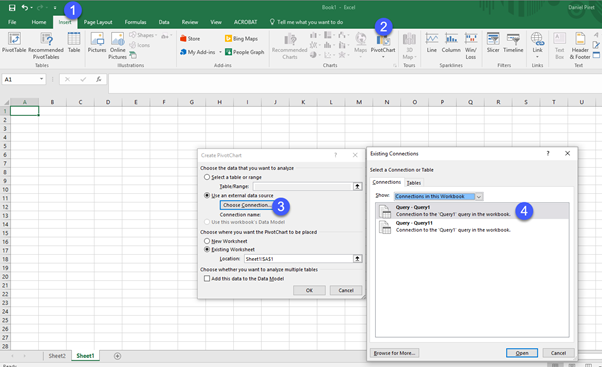
The example creates a PivotChart from the query, from the following menu options: Insert / Pivot Chart / Use an external data source. From there, the existing connections are loaded, which should show the previous query.
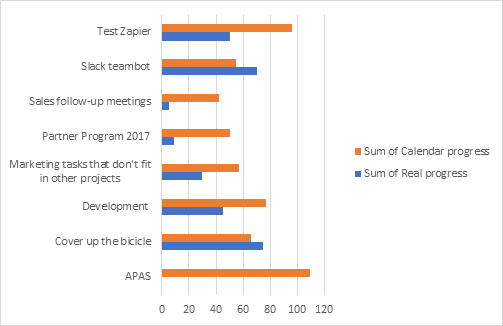
The result is a chart that compares actual progress with progress in the calendar.
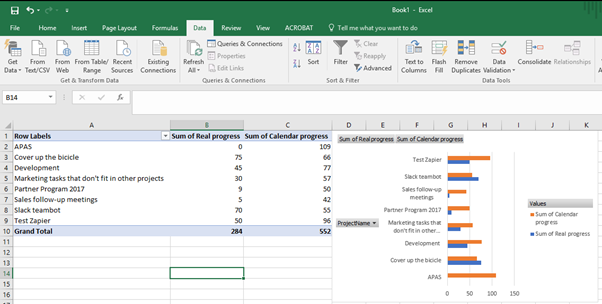
Step 5 – Retrieval
To access updated and real-time data, just click on Refresh from the Data menu.