How to Use Customizable Dashboards in ITM Platform
ITM Platform’s custom dashboards allow you to access built-in dashboards, create your own, or modify existing dashboards to suit your needs.
These dashboards are made up of charts representing helpful information about any entity or entities in ITM platform, such as projects, tasks, risks, issues, revenue, or purchases.

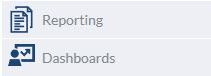
To access the dashboard list, go to the management menu and click on “Dashboards”
If your organization has not yet created custom dashboards, you will have access to the pre-configured ones, which you can duplicate and edit
Editing or creating a dashboard
When editing an existing dashboard or creating a new one, you will find a three-dot menu in the top right corner.
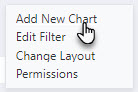
This menu will give you access to add new charts, change the layout, or change the permissions for other users.
Adding a new chart
To add a new chart, you can choose a chart type, such as column, bar, line, area, or pie, and select a table, such as “projects.” Then, choose a category, such as “business goal,” and add a secondary table if needed. Next, select a value, such as “total actual cost,” and choose an operation to perform on that value, such as count, sum, average, maximum, minimum, or the first value.

Once you select the operation, a chart preview will appear, and the chart title will be automatically generated as a suggestion. You can change the chart title at any time at your convenience. When you’re done, click on save, and your new chart will load in the dashboard, showing the actual values.
All charts in one dashboard will share the same data set, allowing you to set a global filter for your dashboard.
Filtering
To edit filters, click on the edit filter button on top of the dashboards. When you click on it, you can add filters that will affect all your charts. If you require charts with different filtering, create a separate dashboard.
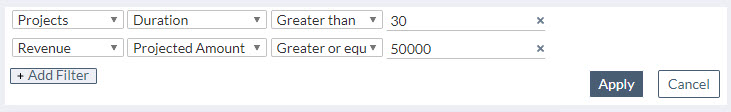
When editing the filter, select a table present in the data set, such as “projects,” and then select by which field you want to filter, such as “duration.” Depending on the field you have chosen, you will have an operator that you can choose from, such as equals, doesn’t equal, includes, doesn’t include, less than, less or equal, greater than, or greater or equal. You can add as many filter lines as you need to tailor your dashboard to your specific needs.
⚠️ Keep in mind that ITM Platform dashboards are fetching your data in real-time, and some of these fields are calculated. Depending on the complexity and volume of your data, plotting your dashboard may take a while. Therefore, be careful when you select calculated fields, such as estimated costs and expected deviations.
Changing Dashboard Layout:
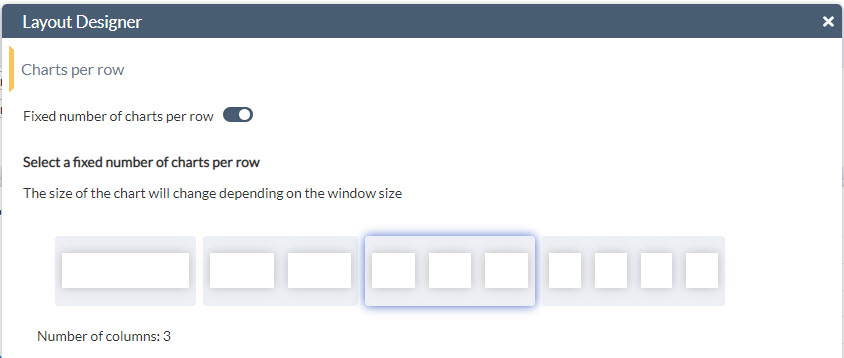
To customize the overall dashboard design, click on “Layout” from the main menu. There are two main options:
- Charts per row: You can choose a fixed number of charts per row or a flexible number of charts per row. When you select a fixed number of charts per row, the chart size will adapt to fit the number of charts you have chosen into a row. If you select the chart width, the number of charts per row will change depending on the window size. If you’re unsure about which option to choose, we recommend the default one, which is a fixed width per chart with a flexible number of charts per row.
- Height/width ratio: You can change the height/width ratio to create different shapes of charts within your dashboard.
Permissions
To access the permissions editor, click on the three-dot menu, then “Permissions.” There, you will see a list of users and roles with access. If you created the dashboard, you will find yourself as an editor.
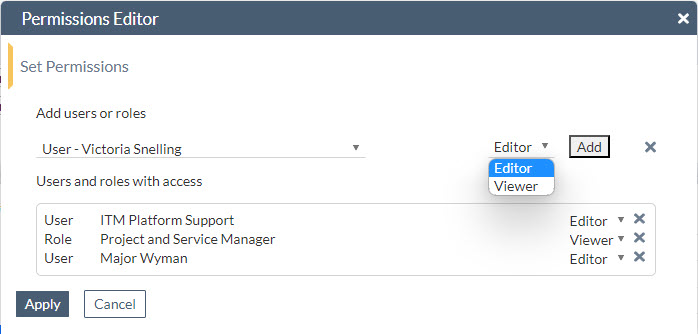
To grant access to other users or roles, simply deploy the drop-down menu and select the particular users or roles you want to give access to. Once you have selected the user or role, choose whether to make them an editor or viewer. Then, click on “add,” and they will be added to the list of users or roles with granted permissions.
Embedding Dashboards
Once you have defined a dashboard in ITM Platform, you can embed it in your own web pages, such as the intranet of your organization. This mode will not require users to log in to ITM Platform since the dashboard credentials will be embedded in the web page.
⚠️ This feature is currently being deployed among users having access to the dashboards.
ITM Platform’s custom dashboards offer a range of features to help you access and visualize your data. From editing and customizing your charts to filtering and changing the layout, you can tailor your dashboard to your specific needs. With the ability to grant permissions and embed dashboards, ITM Platform makes it easy to share your data with others in your organization.