Use of Gantt
ITM Platform uses two formats for task creation and management: the Gantt chart and the task list.
The Gantt chart presents a graphical representation of tasks over the course of a timescale. It can be used to present a schedule or perform monitoring.
Access to main features are found on the button top ribbon and right-clicking on the tasks. The main ones are:
- Add / delete a task / milestone / summary
- Indent / outdent
- Collapse / expand
- Create / view a baseline
- Highlight the critical path
- Update tasks by their dependencies / set automatic task dependency updating
- Export / print to PDF and PNG
- Import from a MS Project file
- Select which columns are visible
- Create / modify dependencies and lags
- Update the project progress report
Select the project where you wish to create the task. Click on the Gantt section
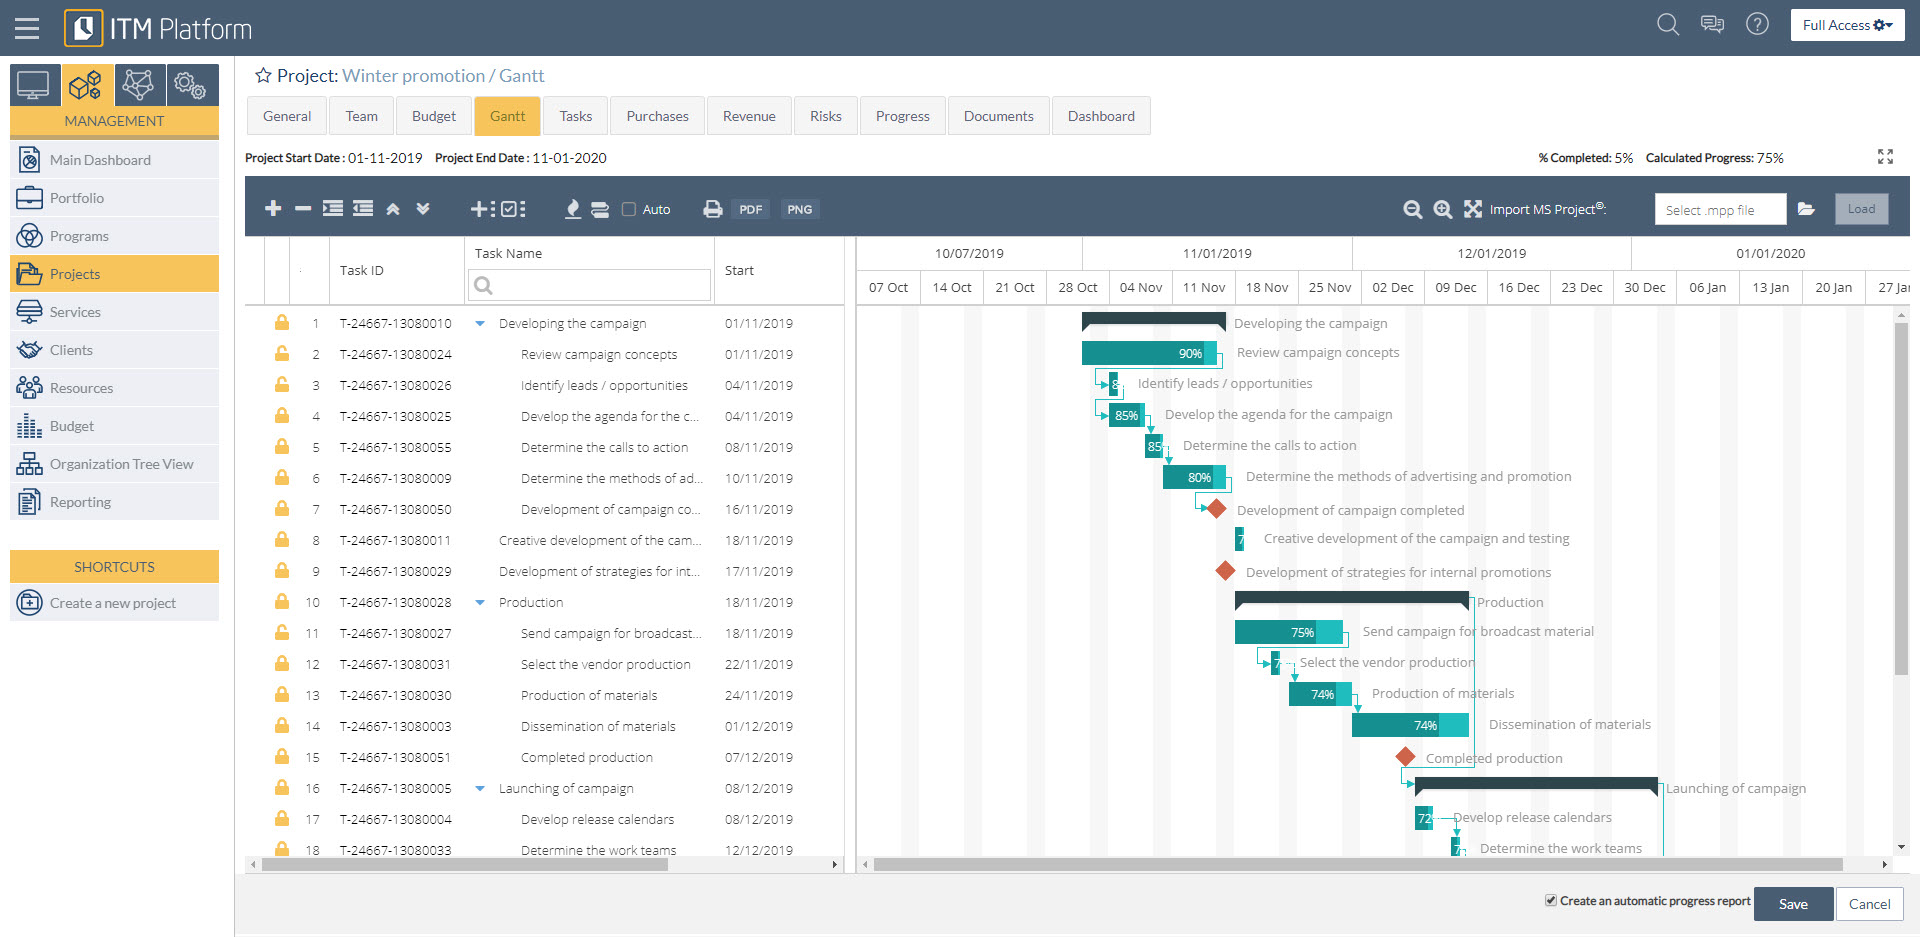
This interface can be used to modify the dates and duration of tasks and perform basic test administration by adding, deleting or moving them within the diagram using the drag and drop functions.
You can also establish dependency relationships between tasks by dragging and dropping with the mouse on the Gantt diagram.
Clicking on the maximize icon will provide a full-screen view allowing you to work more comfortably. Once all the changes have been made, click on the “Save” button to record your modifications.
If you need greater details of each task, click on the identifier to access the full datasheet.