Creation and management of reports
ITM Platform allows you to create customized reports that will be very useful when tracking and controlling the data that is required in real time. All ITM Platform reports are exportable to Excel. In addition, you will be able to create reports and charts with the ITM Platform data in Excel through an integration of both systems using Power Query, as you can see in this article.
Three types of reports can be generated: Three types of reports can be generated:
Lists reports
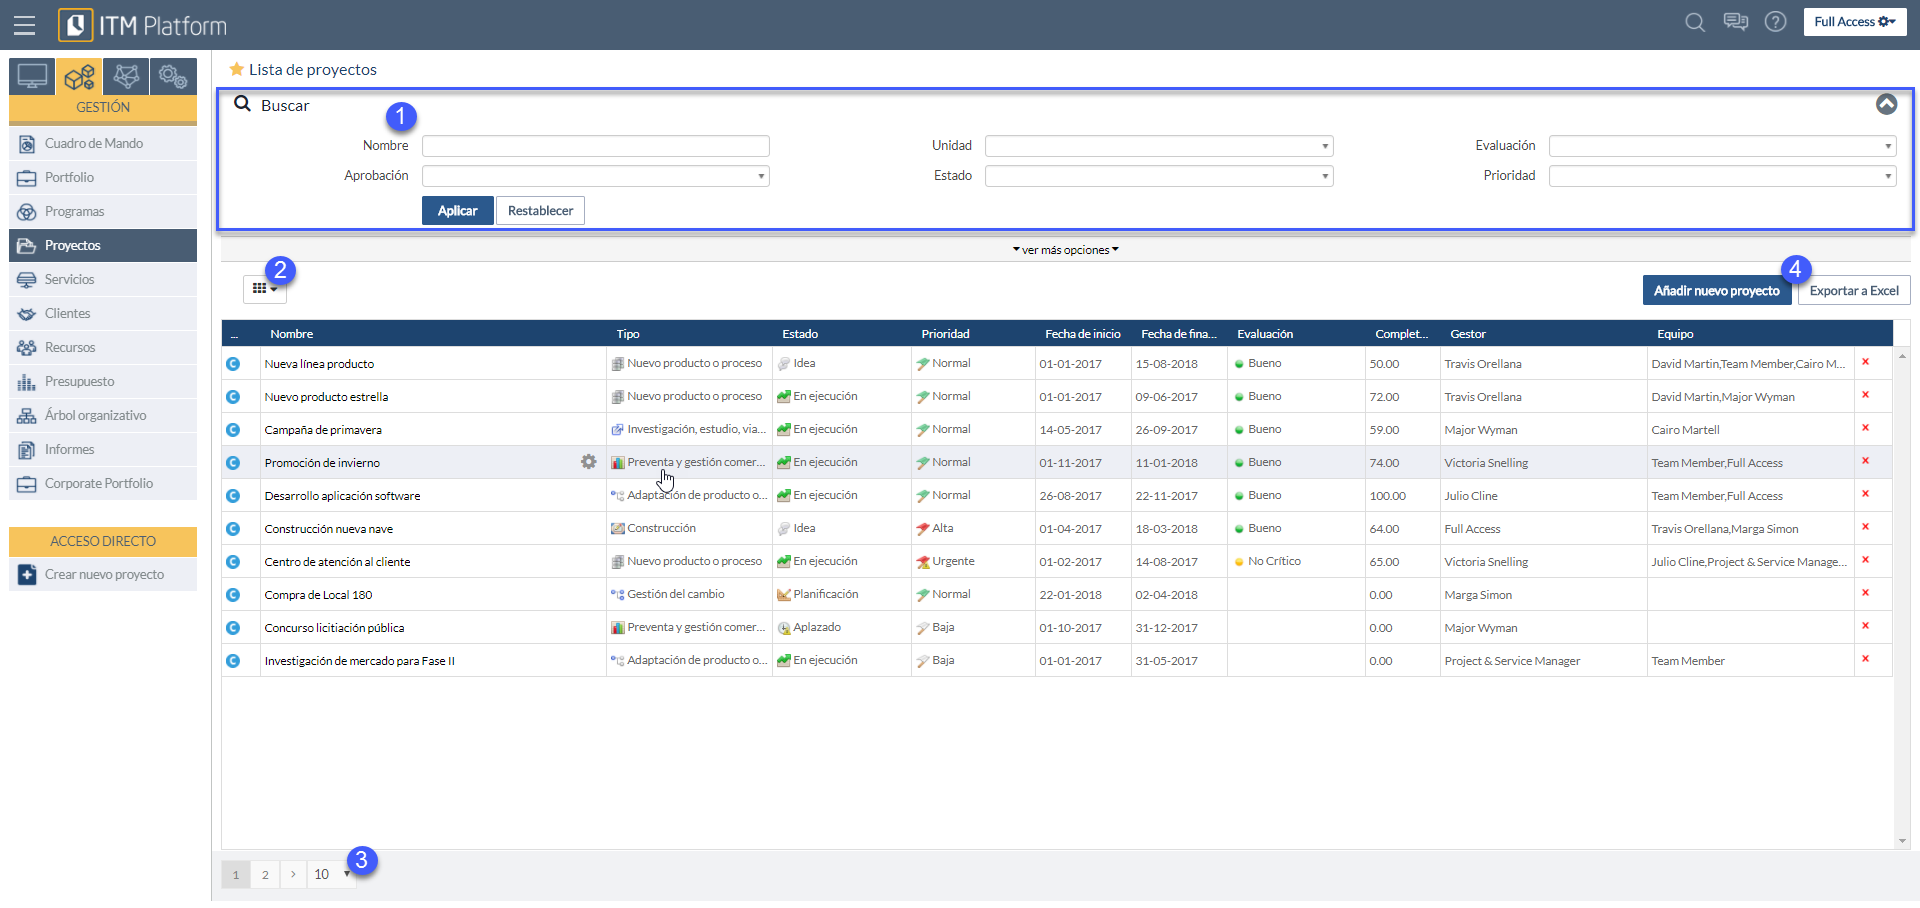
Lists reports can be created from several ITM Platform sections depending on which information you want to analyze. In a large number of sections of ITM Platform you can define and view a list of elements that can be exported to Excel.
For example, in the project area we can generate a table where we can see the most important parameters and characteristics of each project. These lists can be customized (selecting the fields we want to see), filtered (selecting only a group of projects), or configured to have a specific number of rows in the report, and finally exported to Excel (to work with the information in a spreadsheet).
Customized reports
Customized reports are the most recommended in terms of flexibility and ability to analyze any ITM Platform data.
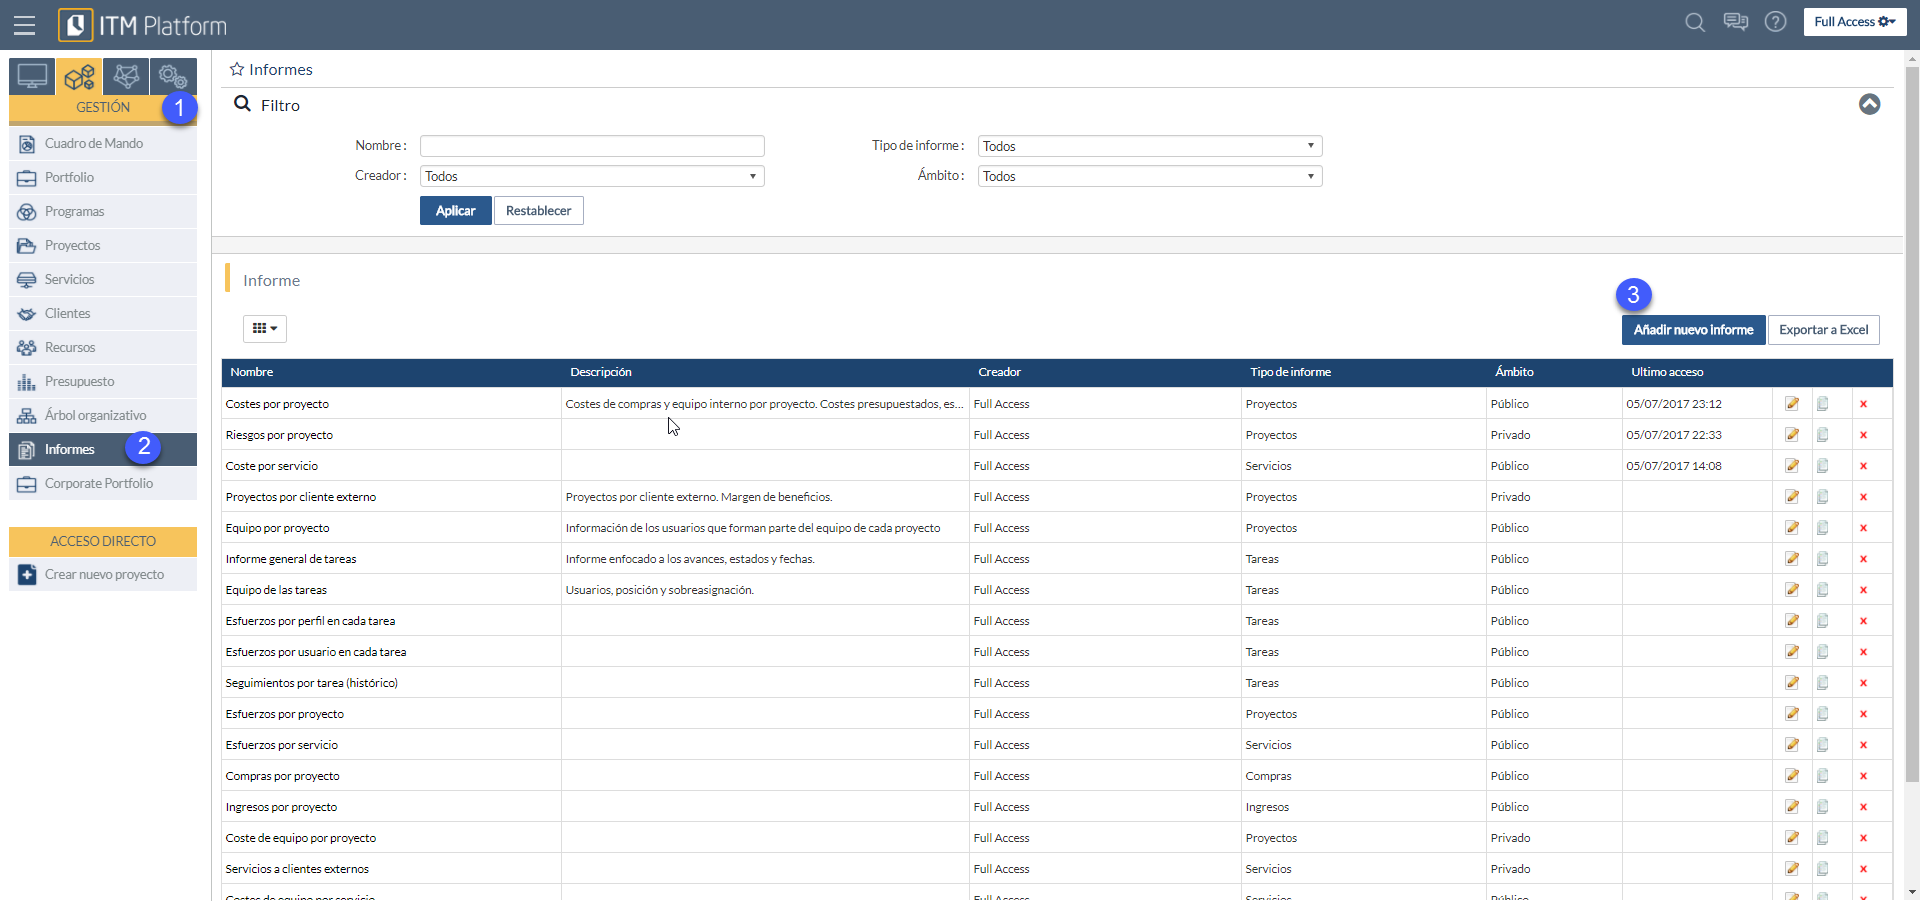
These reports can be managed from the Reports area of the Management menu of your ITM Platform environment. You can create your own reports by clicking Add new report.
Afterwards, the main element of the report must be selected, which will determine the information shown in the report. The main options are:
- Projects
- Services
- Tasks
- Purchases
- Incomes
- Hours report
Once you have selected the main element of your reports, click on the “Create new report” button.
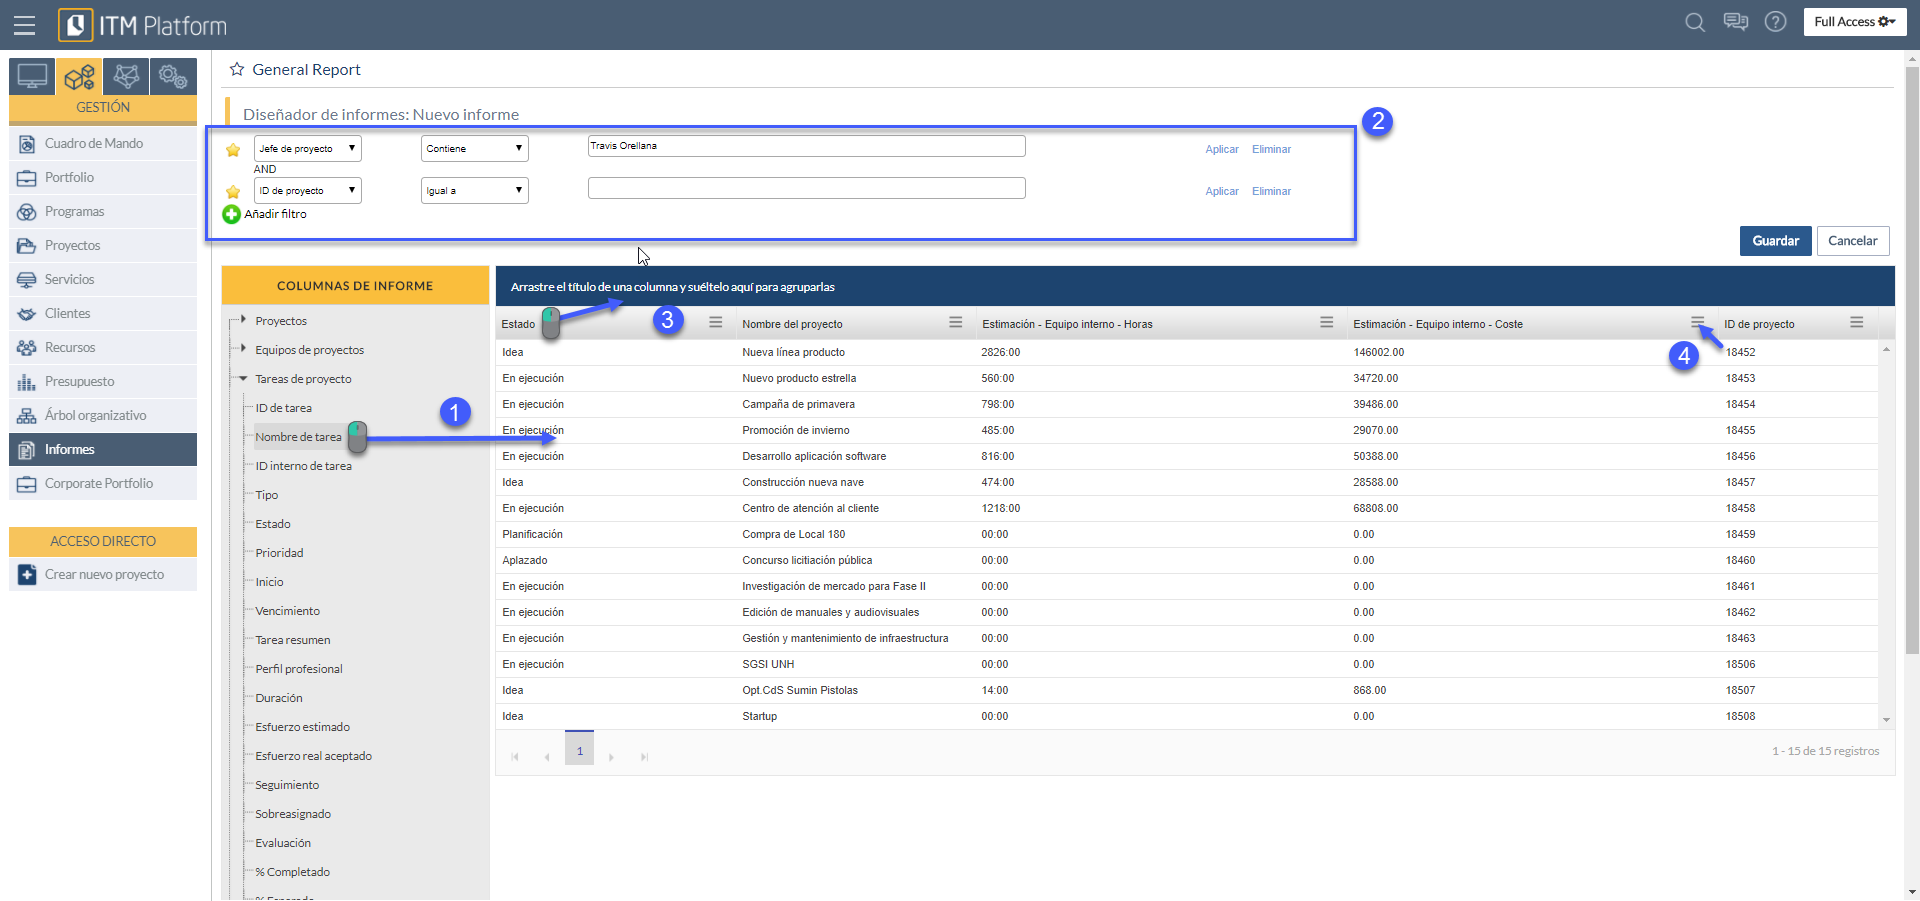
On the next screen, you can create your report and preview it.
In order to create your report, select:
- The fields you wish to include in the report: in order to do this, you have to drag the right column fields to the left.
- The filters that you want to apply in the report, so that you can only see some specific elements.
- The groups that you want to be applied: in order to do this, you have to drag the fields that the report includes to the first line where you can read the text “Drag the title of a column and drop it here to group it”.
- The order of the items shown can be modified for each report field.
Note: Keep in mind that while you are creating the report, you cannot see all the data of it: It is only a preview. So even if you do not preview any data, the final report will present the final data.
Once configured, you can save the report in two different modes:
- Private: it will be visible only to the creator of the report
- Public: It will be visible to all users who can access the reporting area.
Later you can check your saved report as many times as you wish and the updated information will always be displayed in real time. The created reports can be edited by its creator or copied by any user who has access to it.
Predefined reports
Predefined reports were present in previous ITM Platform versions. The functionalities of these reports can be covered by the other types of reports. If you have any questions on how to do it, please contact support@itmplatform.com