Power BI Templates for ITM Platform

Power BI Templates for ITM Platform are for users who want to create dashboards and visualize their organization’s data.
Designed specifically for ITM Platform, these templates provide charts and analysis based on best project management practices. They also offer the possibility of integration with other applications, such as your ERP or CRM.
You can use the templates as a blueprint to create customized reports and dashboards to monitor the performance of your projects, identify issues and make informed decisions in real time.
What you need:
- A template
- Power BI Desktop to customize the template (free)
- A Power BI Service license, if you want to publish it on the internet (optional)
With Power BI Service, you can publish reports in a private environment that only users in your organization can access (verify pricing). Alternatively, you can use Power BI Desktop to create reports and visualizations without publishing them online.
Once you have downloaded the template and setup Power BI Desktop, you can:
- Connect the template to the ITM Platform
- Publish dashboards on the Power BI Service
To create dashboards tailored to your organization, open the template in Power BI Desktop and make the desired changes. You can customize the charts, tables, key figures, and visualizations to suit your needs.
If you need help, you can find the documentation online or request support from ITM Platform or a specialized consultant.
How Power BI Works with ITM Platform
Available templates
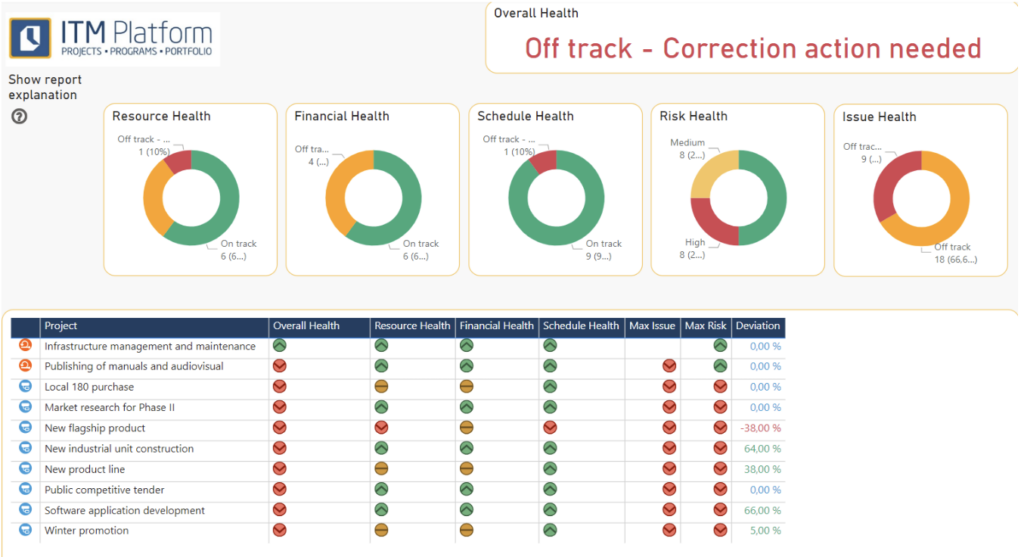 |
Displays the health of the projects and portfolio with standardized health calculations. | |
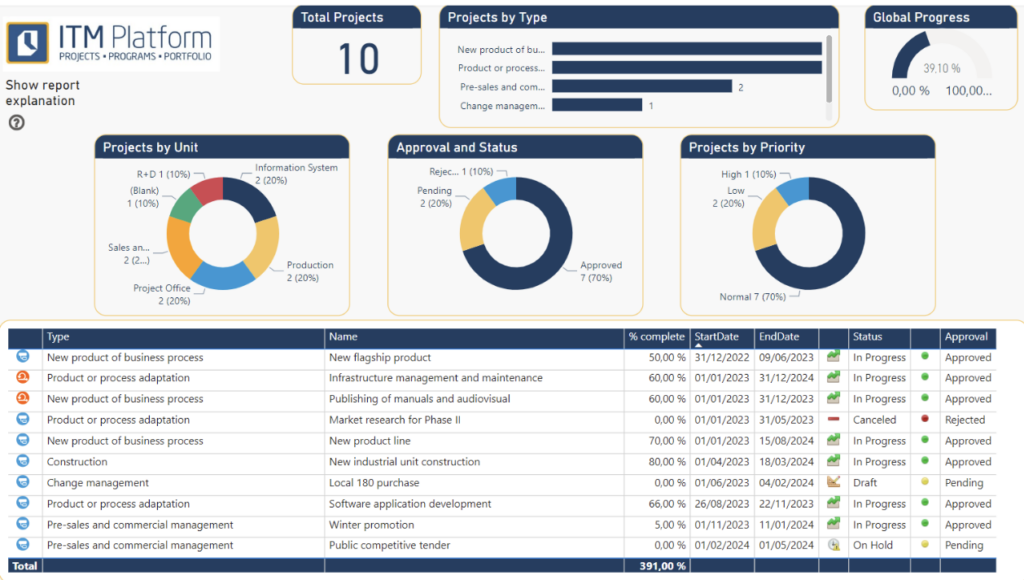 |
List of projects with basic information, including the possibility of obtaining a detailed view of the projects in both waterfall and agile versions. | |
| Financial Analysis |  |
View of budget performance and financial analysis by dimension. |
|
Summary of finance and scheduling
|
 |
In addition to the above view, it includes a view of project scheduling and progress. |
| Effort Analysis | 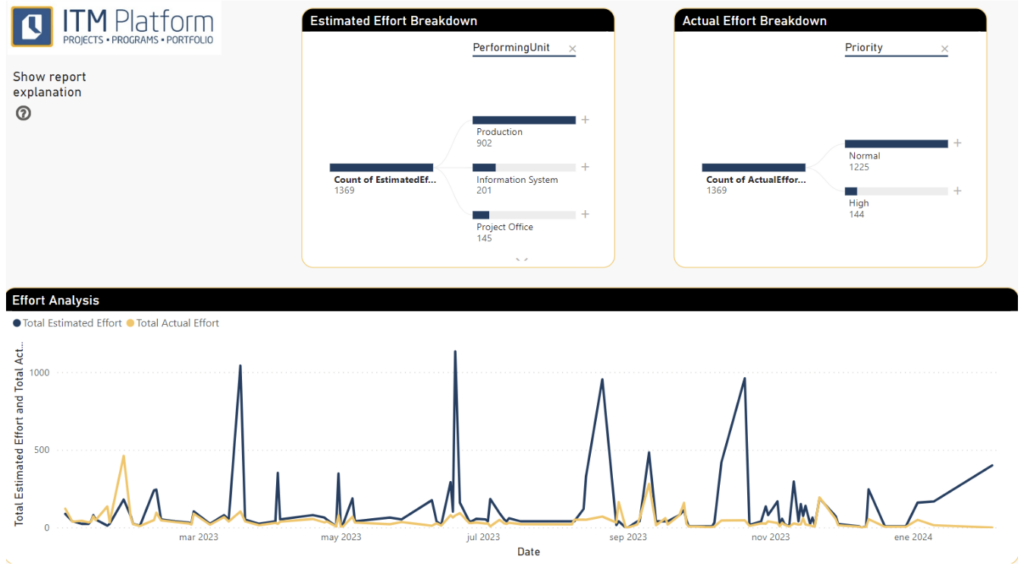 |
View of effort behavior and analysis of such effort by dimensions. |
| It includes all of the above views integrated into a single report, ideal for the PMO or an executive. |
Connecting the template to ITM Platform
Essentially, you need to edit the instance parameters and API key, click “Update”, and check that the information has loaded correctly.
- Download the PBIX sample and open it in Power BI Desktop.
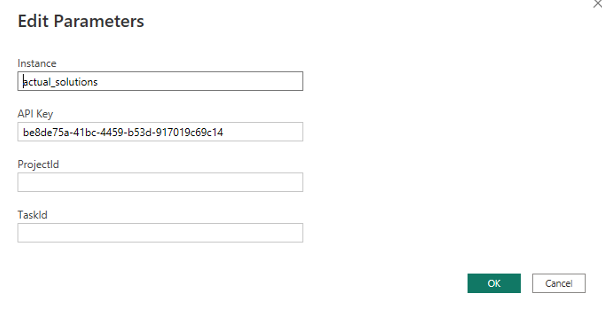
- Click on Transform Data → Edit Parameters
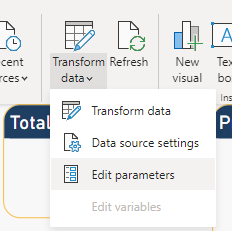
- Fill in the values for the Instance (environment) and API Key, and click OK. The ProjectId and TaskId parameters are only required to make changes to the queries.
- To find the Instance, look for the first part of the URL of your ITM Platform account. For example, if your ITM Platform URL is https://app.itmplatform.com/mycompany/UserPages/Home.aspx, the instance would be “mycompany” (without quotes)
- To generate the API Key, go to the “My Profile” section of your ITM Platform account and select the “API Key” tab.
- Click the “Generate” button to create a new API Key.
- Once the API Key is generated, copy it and store it in a safe place. Note that only the last four characters of the key will be displayed, so make sure to copy the entire key.
- Paste the API Key into the “API Key” parameter.
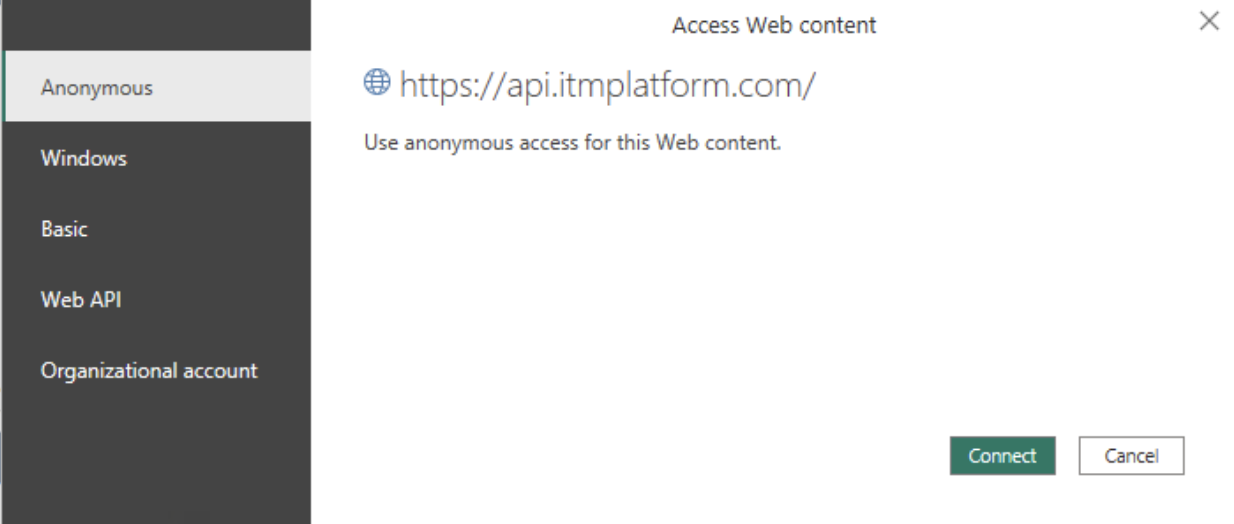
- If a login dialogue is displayed, the Anonymous access option must be selected.
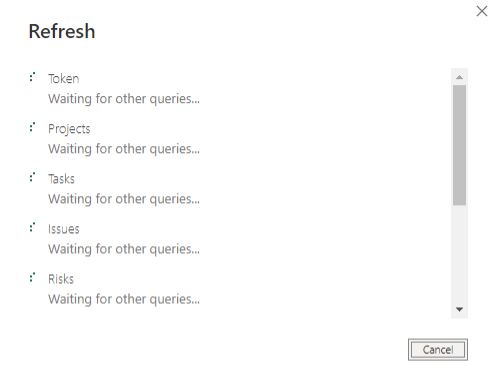
- Click on “Update” and wait for the update process to finish. It may take several minutes, depending on the amount of information in your environment.
![]()
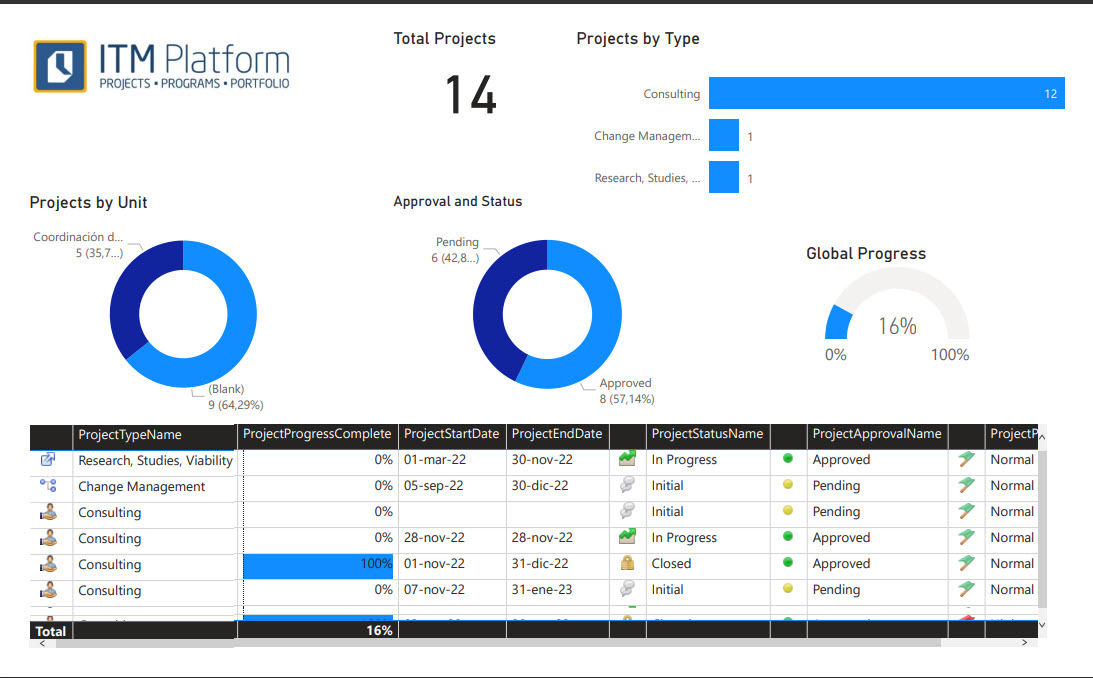
- Verify that the information has been uploaded to the report:
Publish dashboards in the Power BI Service
To access and keep up-to-date the online reports of the Power BI service, you need to publish the PBIX files in the Power BI web application, set up credentials and schedule the automatic update of the record.
Proceed as follows:
- Ensure that the local Power BI file is connected and updated according to the procedure described above.
- Publish the PBIX in the Power BI web application by clicking the Publish button in Power BI Desktop.
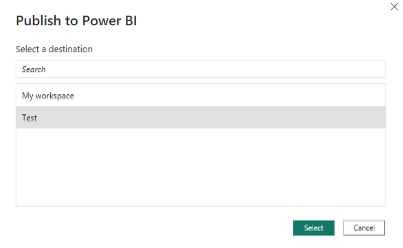
- Choose the place of publication. It is recommended to use a custom workspace, not “My Space”.
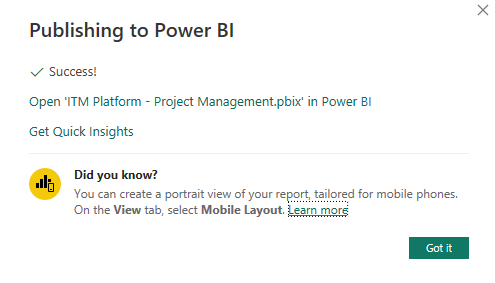
- Wait for the publication process to complete:
- Navigate to the workspace to identify the dataset:
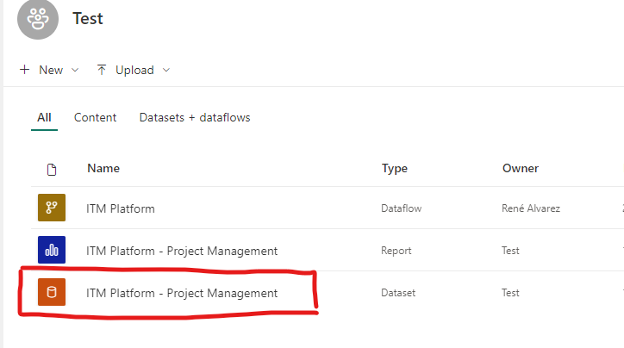
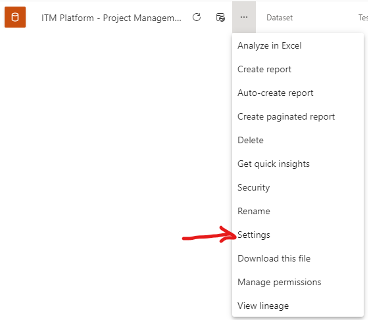
- Click on … to display the dataset menu and click on Configuration:
- Locate the Credentials section of the data source and click on “Edit credentials”.

- Set or check that the authentication method is Anonymous, and the privacy level is Organizational. Do not activate the option to skip the connection test.
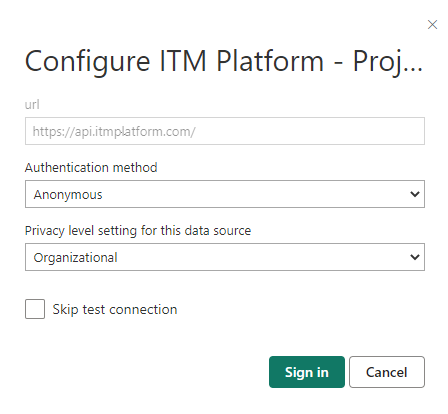
- Click Log In to check if the data source is accessible:

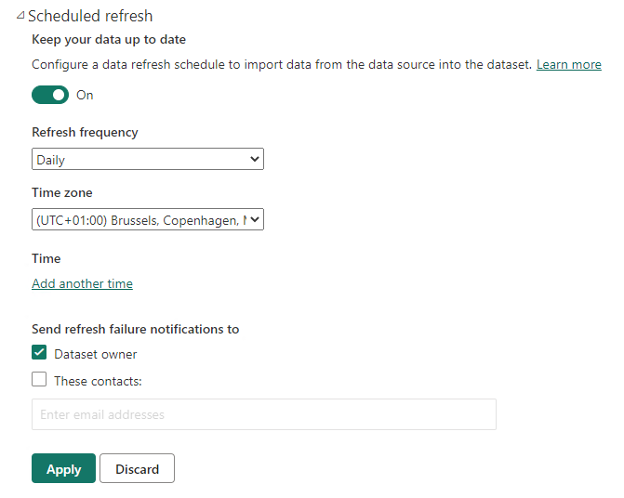
- Expand the Auto-Update section and set the desired schedule:
- Click on the link above to display the dataset:

- Click on Refresh and wait for the dataset to be updated:

- Check that the report displays correctly:

The Power BI templates for ITM Platform are tools for creating dashboards and visualizing project data. They provide charts and analysis based on best project management practices and the ability to integrate with other applications.
- To customize templates and create custom dashboards, open the template in Power BI Desktop and make changes to charts, tables and visualizations.
- To access reports online and keep them up to date, publish PBIX files in the Power BI web application and configure the credentials and schedule to update records automatically. Power BI Desktop can be used to create reports and visualizations without publishing them online.
When to use ITM Platform Custom Dashboards or the connection to Power BI?
ITM Platform’s customizable dashboards provide analytics that enable users to visualize and monitor the performance of their projects in real-time. However, these features may be more limited than those offered by Power BI.
Therefore, if you require more comprehensive data integration from third-party applications or advanced data analysis and visualization features, we recommend using Power BI.
The choice between ITM Platform and Power BI dashboards depends on the specific data analysis and visualization needs of the organization.
.