Resource Analysis
Resource Analysis is a feature within ITM Platform that enables resource managers to analyze users’ capacity, estimated, and actual efforts across projects and services. This tool provides insights into resource utilization, helping you identify discrepancies between planned and actual work, optimize project planning, and improve overall efficiency.
To access the Resource Analysis feature, Navigate to the MANAGEMENT menu and Select Resources.
The Request Section
The Resource Analysis interface begins with the Request section, where you configure your analysis parameters. This section comprises two main parts:
- Mode Selection: Choose how you want to aggregate the data—either over time intervals or as total figures.
- Filter Options: Specify which components (projects or services) you want to include in your analysis.
Once you’ve set your preferences, click Apply to generate a pivot table based on your criteria. Your configuration will be saved and automatically loaded the next time you access this section.
Mode Selection
The Mode determines how the data will be aggregated in your analysis.
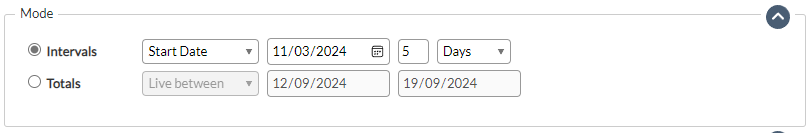
Intervals
Selecting Intervals generates a table aggregating hours over specific periods such as days, weeks, months, or quarters. This mode is ideal for analyzing efforts over time.
- Period Settings:
- Start Date: Define a starting point and specify the number of periods to analyze forward from that date. For example, analyze 4 weeks starting from September 1st.
- Last: Analyze a set number of periods backward from the current date. For example, analyze the last two quarters.
Depending on your selection, additional fields will appear to accommodate your request.
Totals
Choosing Totals aggregates all efforts and hours without dividing them into periods. This mode offers two main options:
- Live Between: Returns all components (projects or services) that were active at any point between the specified start and end dates.
Example: If you set the dates from January 1st to December 31st, all projects active during that year will be included, even if they started before or ended after those dates. - Strictly Between: Returns components whose start and end dates fall entirely within the specified range. Example: To focus on projects that started and ended within the second quarter, select Strictly Between and set the dates from April 1st to June 30th.
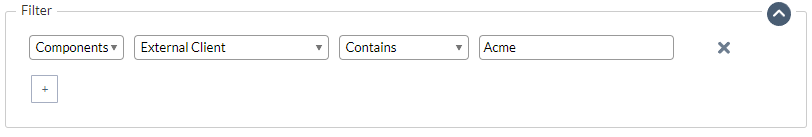
Filter Options
The Filter section allows you to narrow down the components included in your analysis. You can filter by various criteria such as priority, client or duration.
Generating the Pivot Table
After configuring your settings, click Apply. The system will generate a pivot table based on your selections, displaying the estimated and actual efforts for the chosen components and resources.
Your configuration is automatically saved and will be retrieved the next time you access this section, allowing for quick and consistent analysis.
The Pivot Table
The pivot table provides a flexible and detailed view of your data, enabling you to focus on the aspects most relevant to your needs.
Pivot Options
At the top of the pivot table, you have three options to organize your data:
 Component – Work Item: Displays projects or services at the first level, followed by tasks or activities, and then users. This view is useful for analyzing efforts at the task level within each project.
 Component – User: Shows projects or services first, users second, and work items third. This view helps you see how each user contributes to different tasks within a project.
 User – Component: Lists users at the first level, followed by projects or services. This view is ideal for analyzing each user’s involvement across various projects. In interval mode, this option will add the Capacity column for each interval, allowing you to compare it with the estimated and actual values.
Select the pivot option that best suits your analysis needs.
Viewing Estimated and Actual Hours
Depending on the Mode you selected, the pivot table will display different columns:
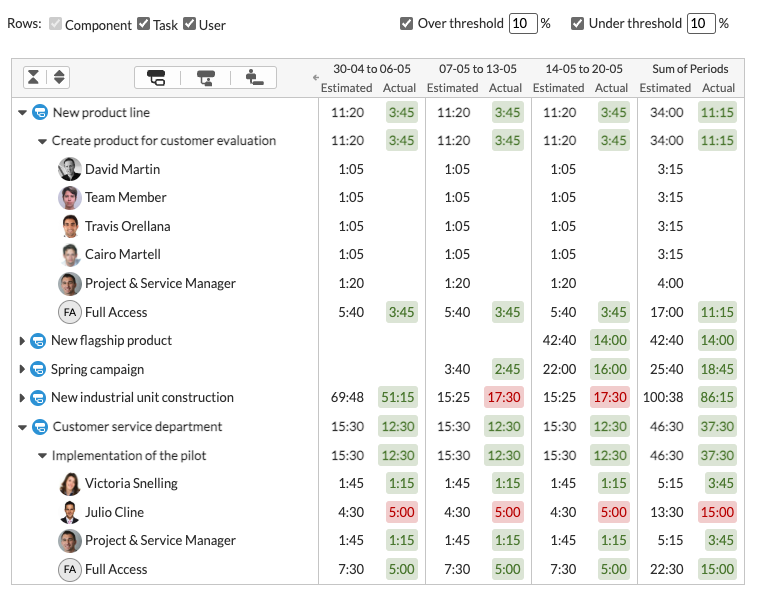
Intervals Mode
- Period Columns: Each period (e.g., week, month) has its own column, showing the Estimated Hours and Actual Hours for that period.
- Summary Column: An additional column provides a total of the estimated and actual hours across all periods for each row.
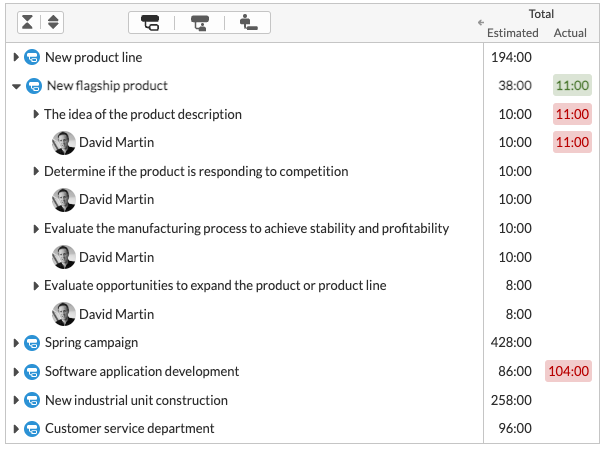
Totals Mode
- Total Hours Column: A single column shows the total Estimated Hours and Actual Hours for each row, giving you an overall view without time segmentation.
Customizing the Table
You can tailor the pivot table to focus on the most relevant information:
- Toggle Rows: At the top of the table, you can deselect certain levels of detail. For example, if you don’t need to see individual tasks, you can unselect the Work Item row, resulting in a cleaner, high-level view.
- Expand/Collapse: Use the expand and collapse icons next to each item to view or hide detailed information as needed.
- Highlighting Values Based on Thresholds: Adjacent to the Filter Options, you can highlight values in your pivot table based on their relationship to other metrics, setting over and under threshold percentages to compare Actual values to Estimates and Estimates to Capacity (where available). Values that exceed or fall below these thresholds will be colorized in the pivot table, helping you quickly identify significant variances.
Examples of Resource Analysis Use
1. Comparing Estimated vs. Actual Efforts for Projects
Suppose you want to assess how accurately the estimated efforts align with the actual efforts across your projects.
- Mode: Select Totals.
- Totals Option: Choose Live Between and set the dates covering the fiscal year.
- Filter:
- Priority: High
- Client: Acme Corp
- Pivot: Select Component – Work Item to see the breakdown of tasks.
- Apply: Review the pivot table to compare the estimated and actual hours for each task within your high-priority projects for Acme Corp.
This analysis can help identify projects or tasks where the actual effort significantly deviated from estimates, providing insights for future planning.

2. Monitoring Efforts Over Time
To monitor how efforts are distributed over the next quarter:
- Mode: Select Intervals.
- Period Settings:
- Start Date: Set to the first day of the next quarter.
- Number of Periods: Choose 3 months.
- Filter:
- Status: In-progress.
- Is Service: false (only projects)
- Pivot: Select Component – User to see how users contribute to each project over time.
- Apply: Analyze the estimated and actual hours for each period, identifying trends or variances that may require attention.

3. Evaluating Individual User Contributions
If you want to evaluate how individual users’ actual efforts compare to estimates:
- Mode: Select Totals.
- Totals Option: Choose Live Between and set the relevant date range.
- Pivot: Select User – Component to focus on each user’s contributions across projects.
- Apply: Examine the total estimated and actual hours for each user, identifying discrepancies or outstanding performance.

Tips for Effective Resource Analysis
- Regular Monitoring: Use Resource Analysis periodically to keep track of how actual efforts align with estimates, enabling timely adjustments.
- Identify Patterns: Look for recurring discrepancies between estimated and actual efforts to improve future estimations.
- Leverage Filters: Utilize the filter options to focus on specific clients, projects, or teams relevant to your analysis.
- Simplify Data: Customize the pivot table by toggling rows and collapsing levels to make the data more digestible.
Resource Analysis in ITM Platform is a powerful tool for gaining detailed insights into your team’s estimated and actual efforts. Combined with the Capacity Planning features, custom dashboards, and optional integrations with third-party tools such as the Power BI templates, it provides a comprehensive solution for resource management.
For further assistance or inquiries, please contact the support team.