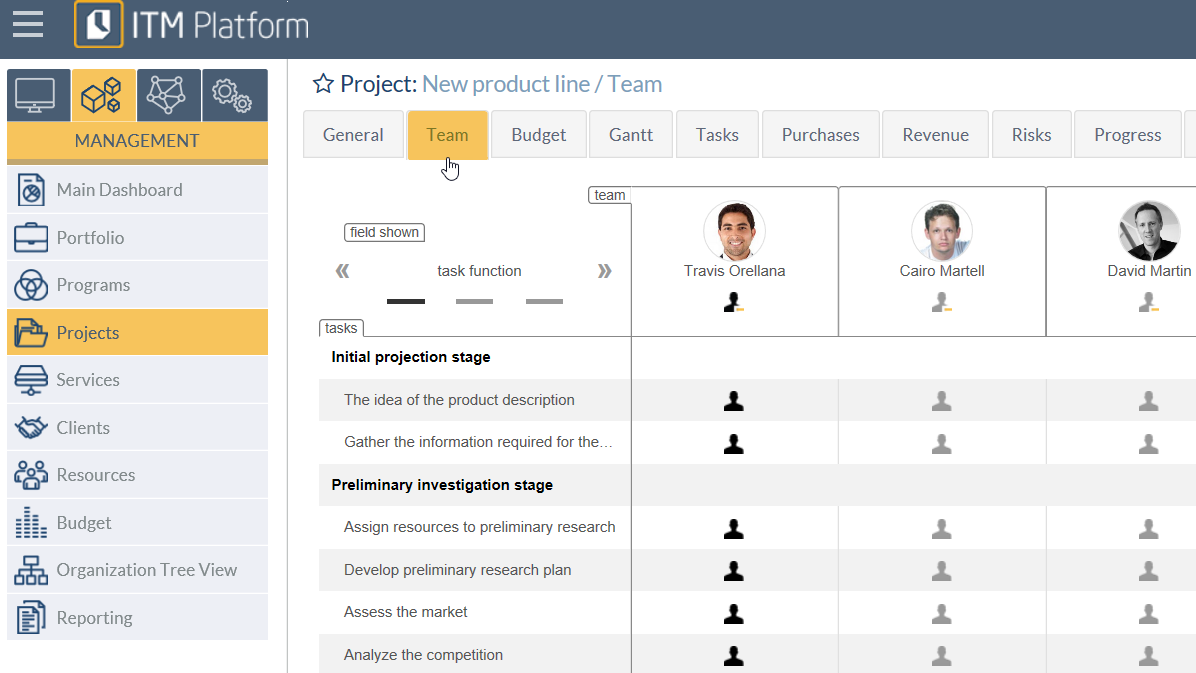
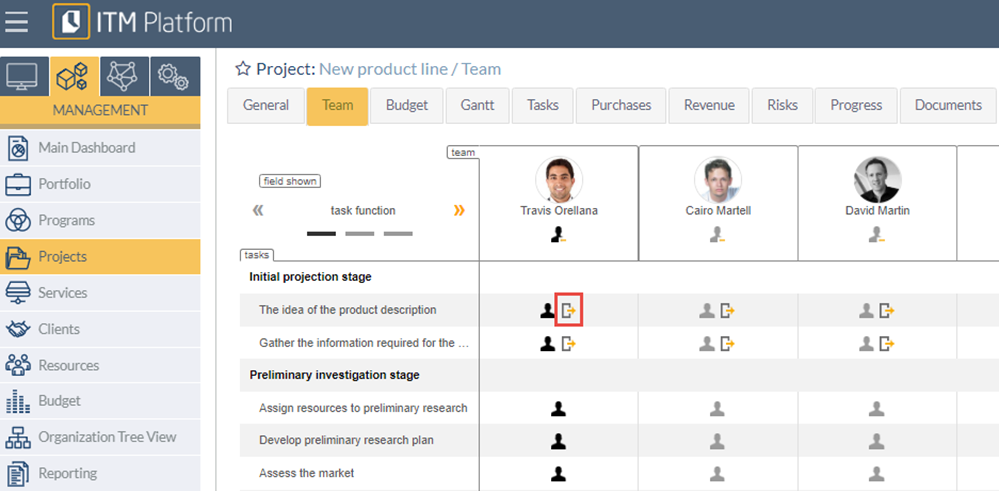
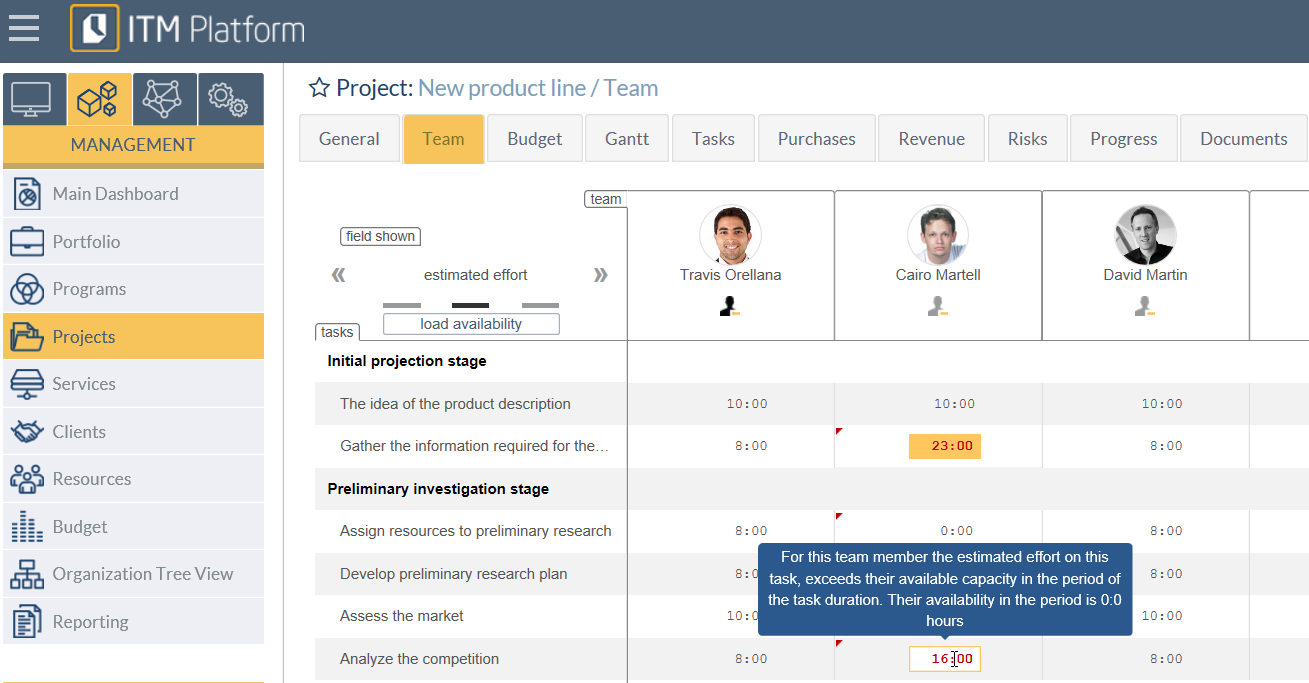
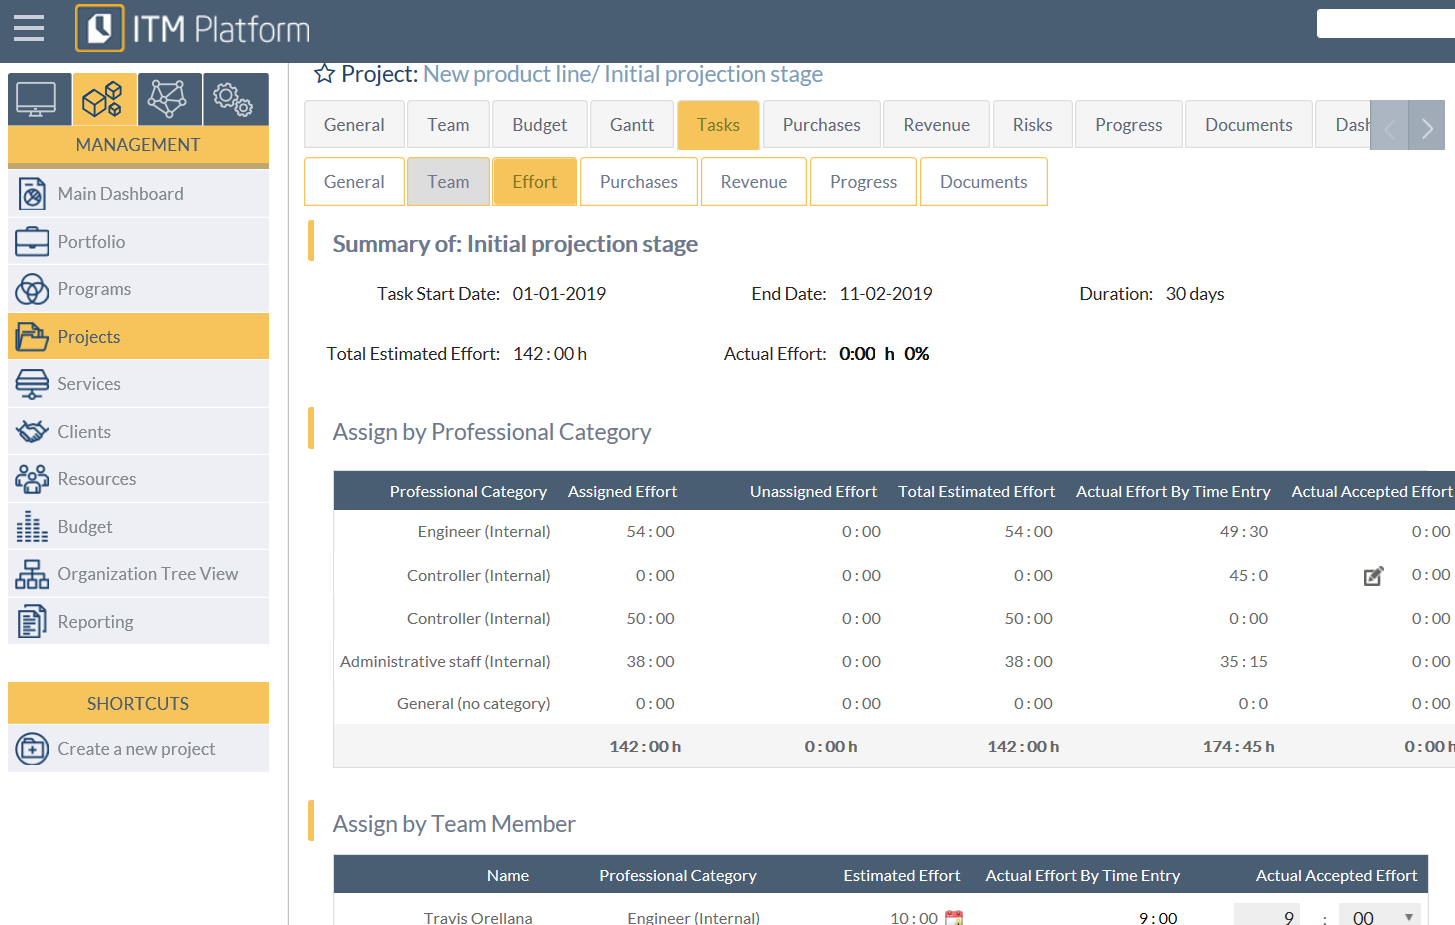
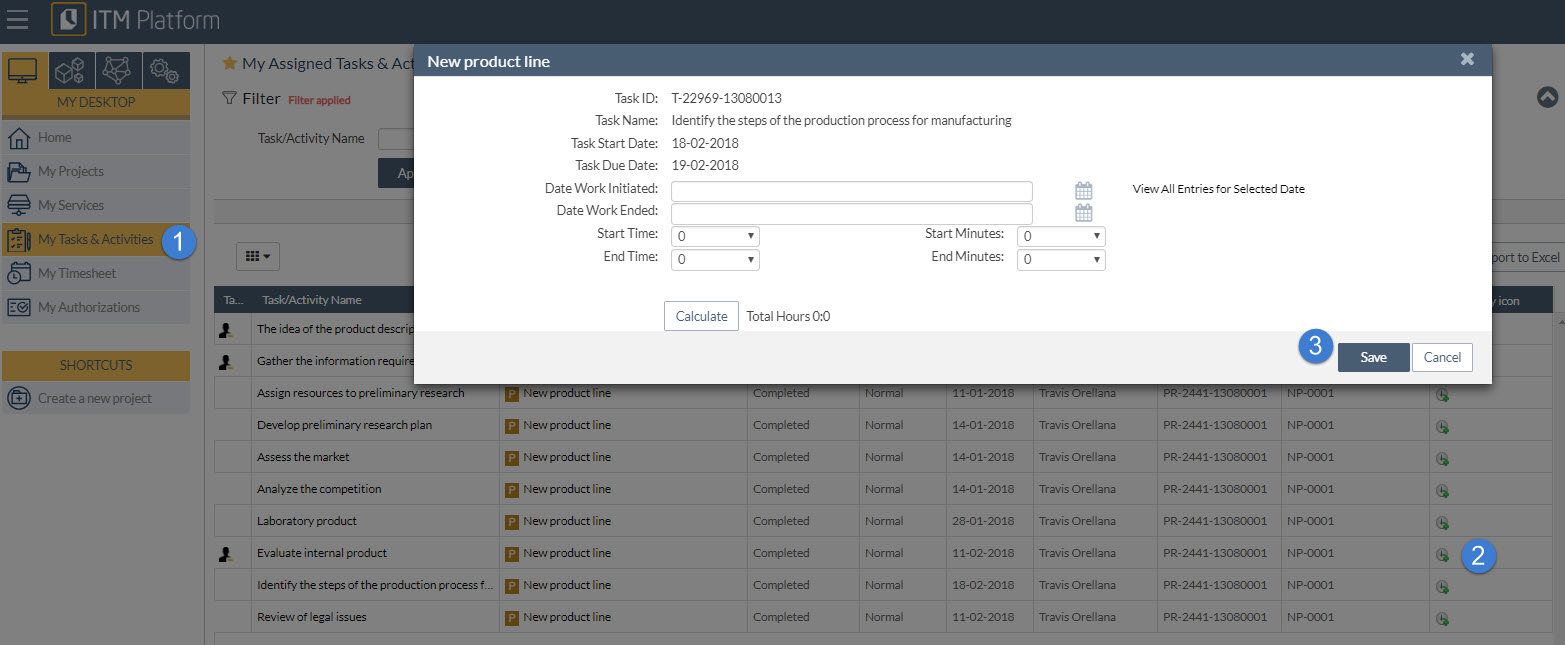
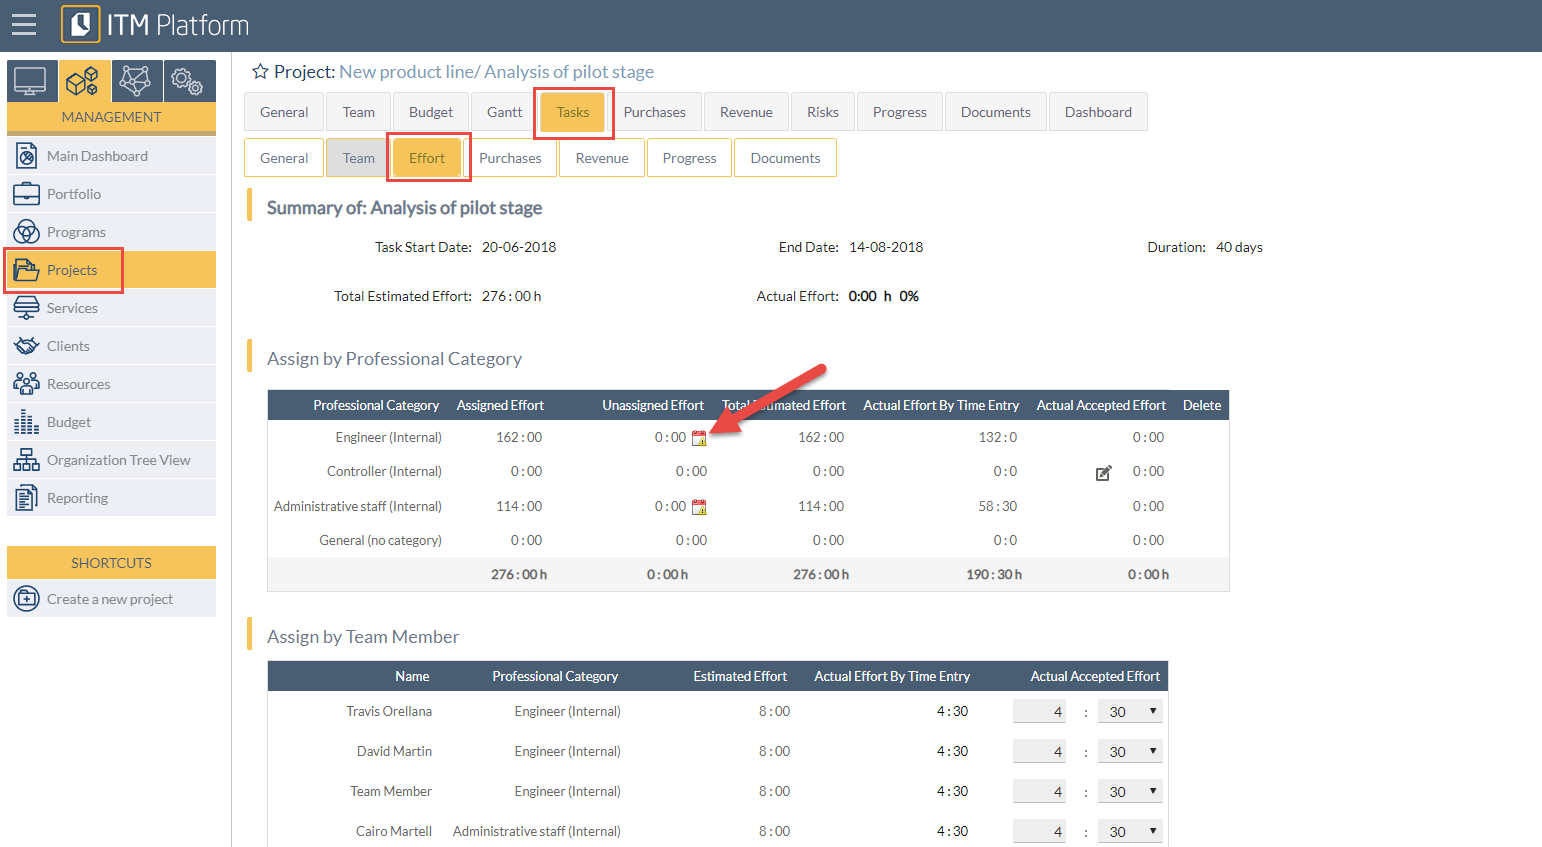
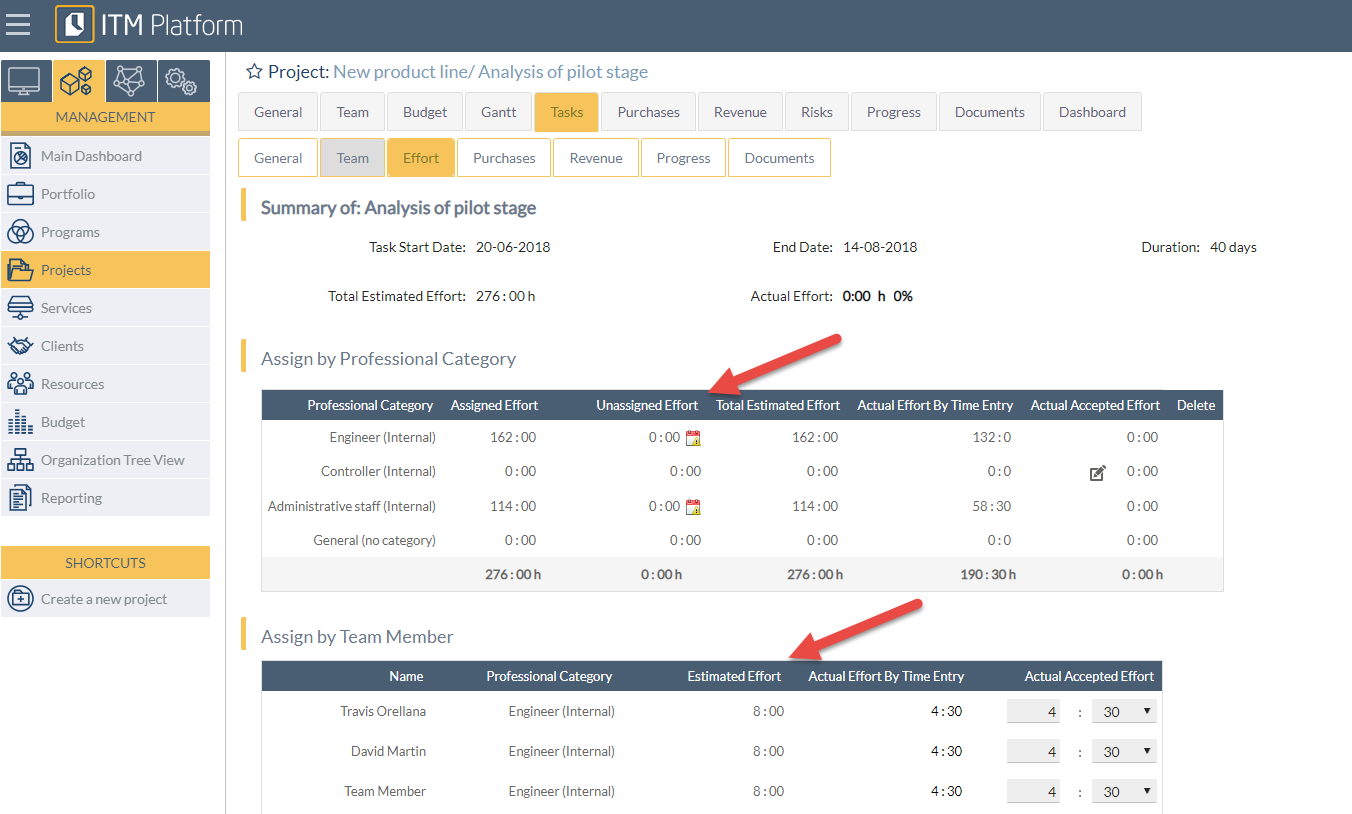
Task Screen: Efforts per professional category and team member
While the above methods are enough for project managers, they lack an overview over all projects at the organization level. Whenever a team member is available to work full time on a task of one project manager, if another project manager is assigning the same team member on another task, a conflict may ensue.
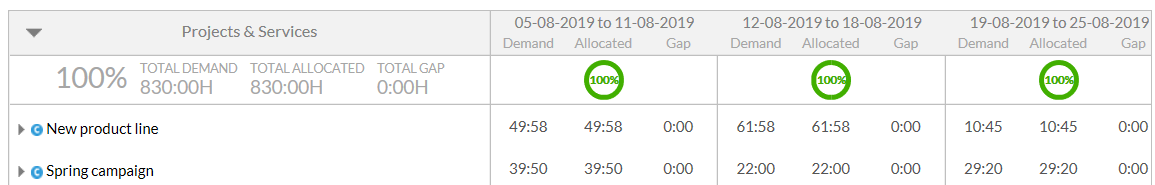
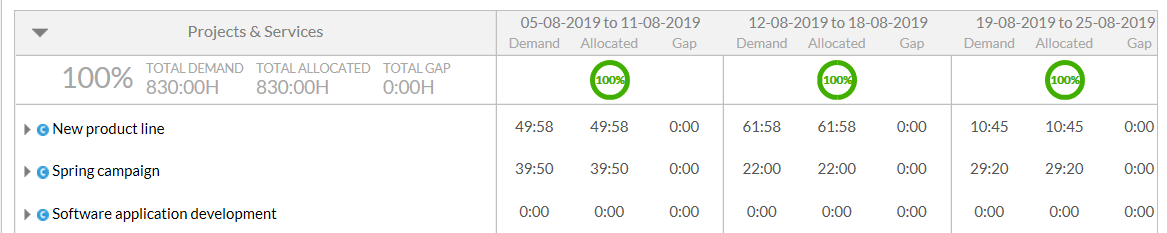
Full access users, typically PMOs, program and portfolio managers, can leverage more powerful resource planning. To facilitate the resolution of these conflicts, the resource management area gives the full overview of demand and capacity over all projects:
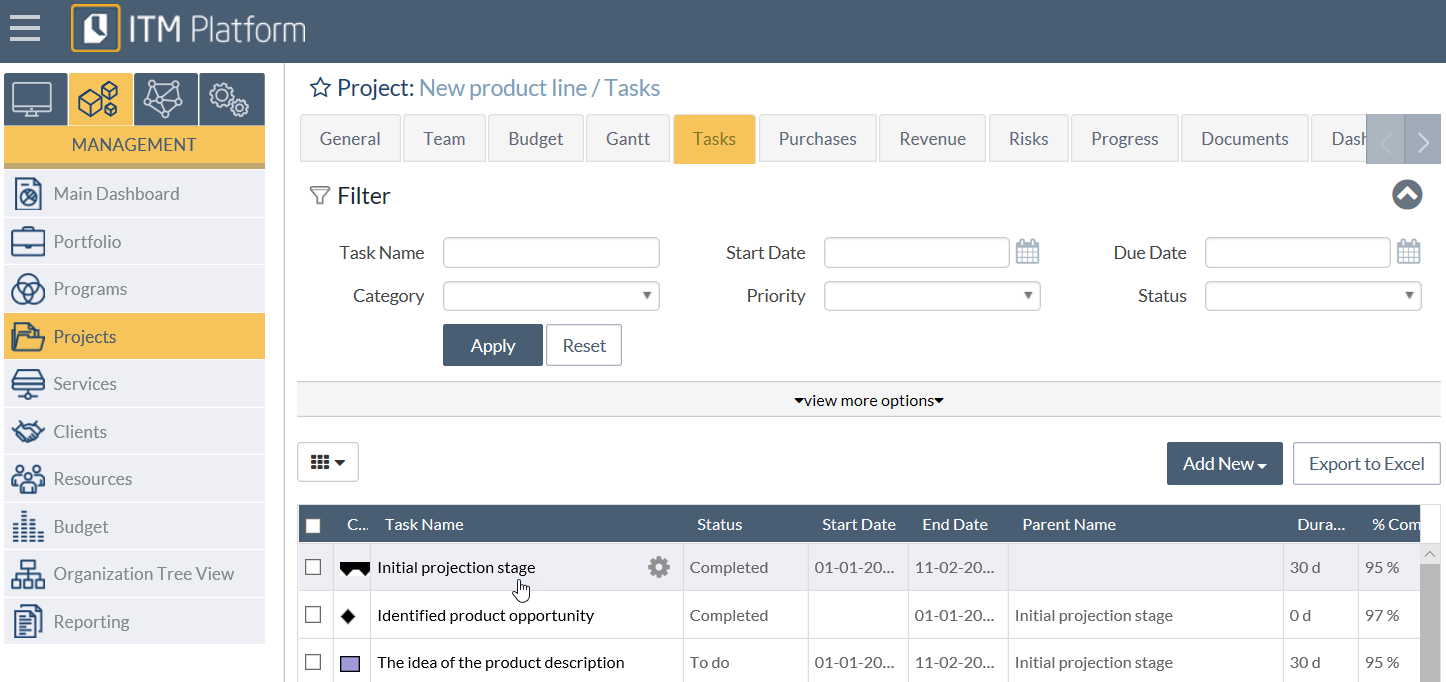
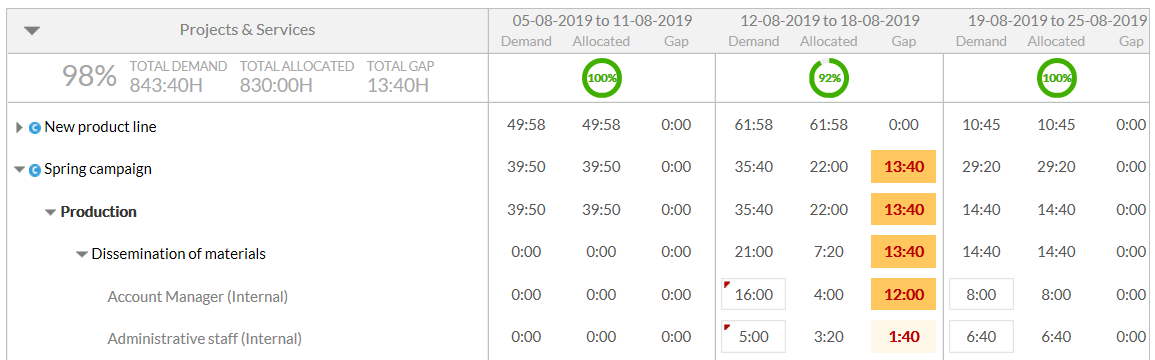
- The demand on a project or task represents the total effort planned by the project manager as in the team control section or task area, including both assigned and unassigned efforts
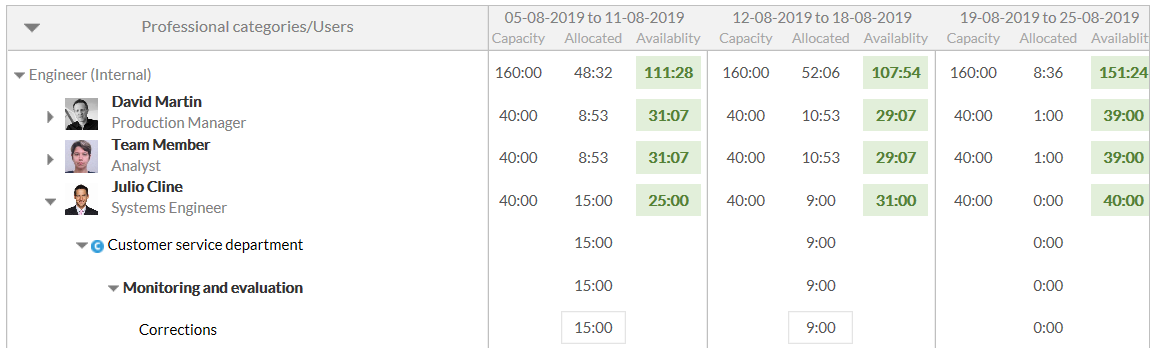
- The capacity of a professional category and its underlying individual resources is the sum of their working hours in the period
- The allocated hours are the sum of all estimated efforts already assigned by the project managers in the team control or task screen.
Note: The calculation of the capacity per professional category already takes into account the holidays of all individual resources.
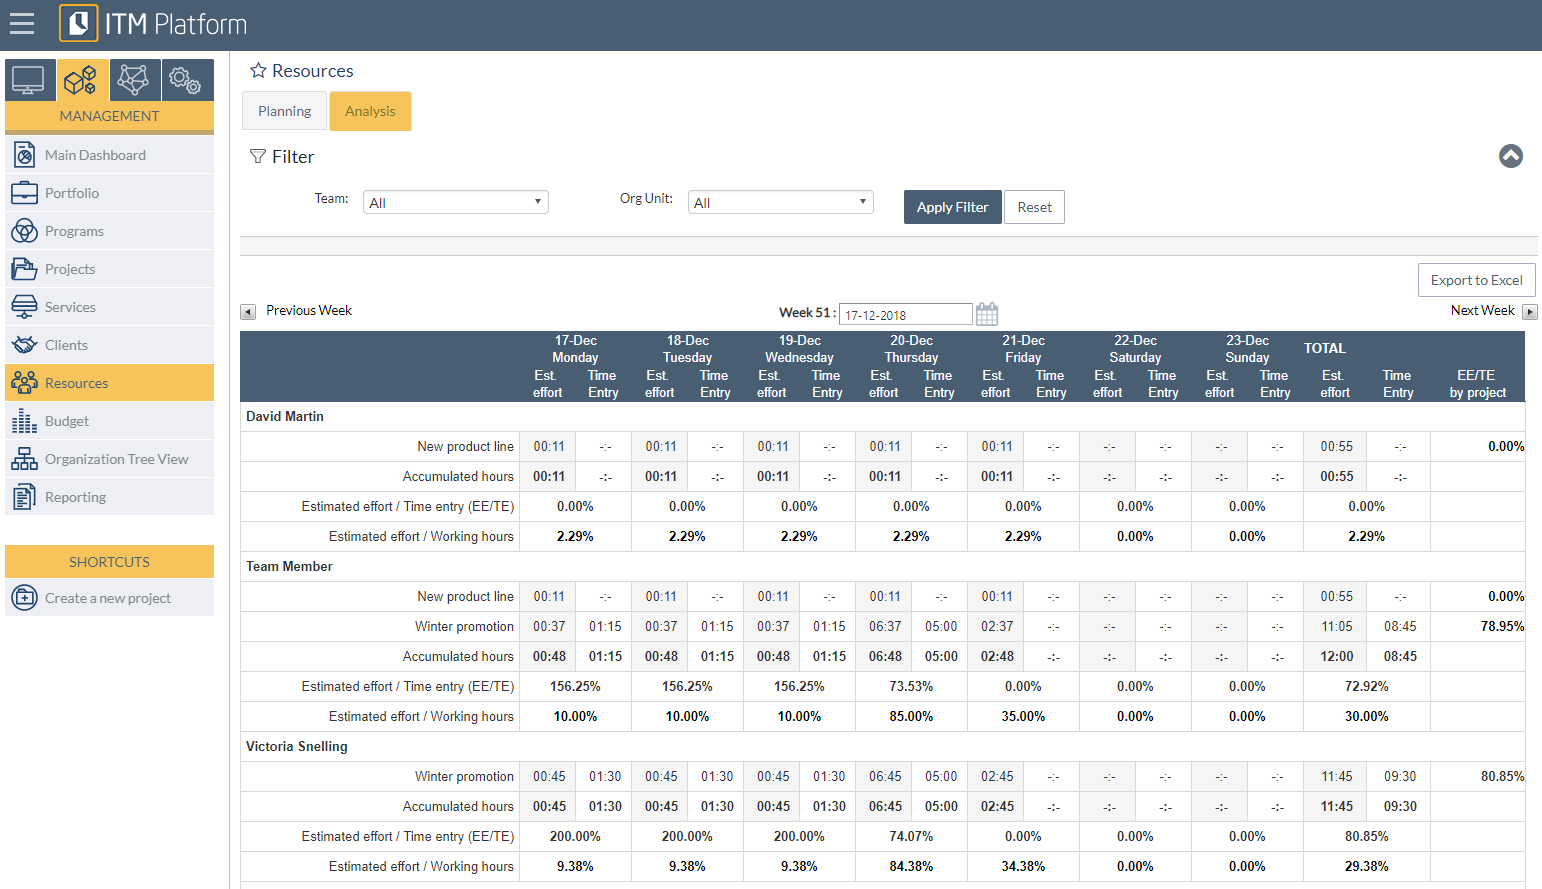
The resource management screen is divided in three sections:
- period selection/filter
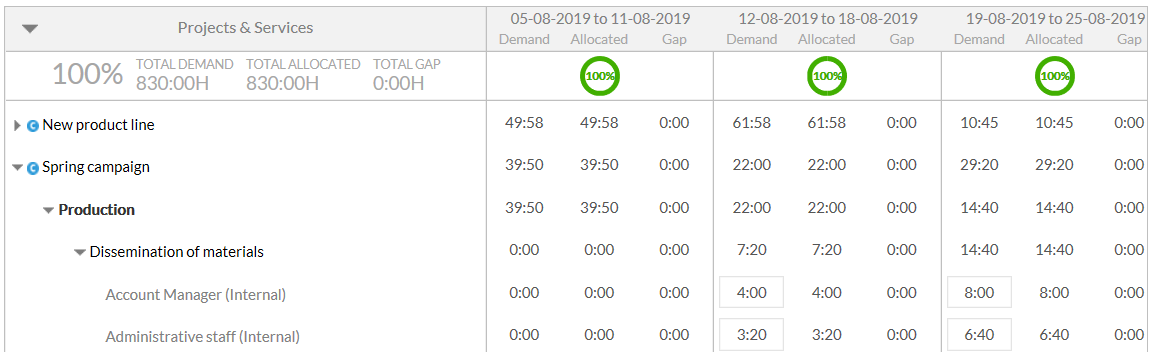
- demand section
- resource allocation section
Note: The upper and lower level panel are designed to display the same period.
Note: By using the horizontal scroll bar, both panels will scroll horizontally. This allows you to always have an integrated view of the project demand and allocated resource capacity in the same period.
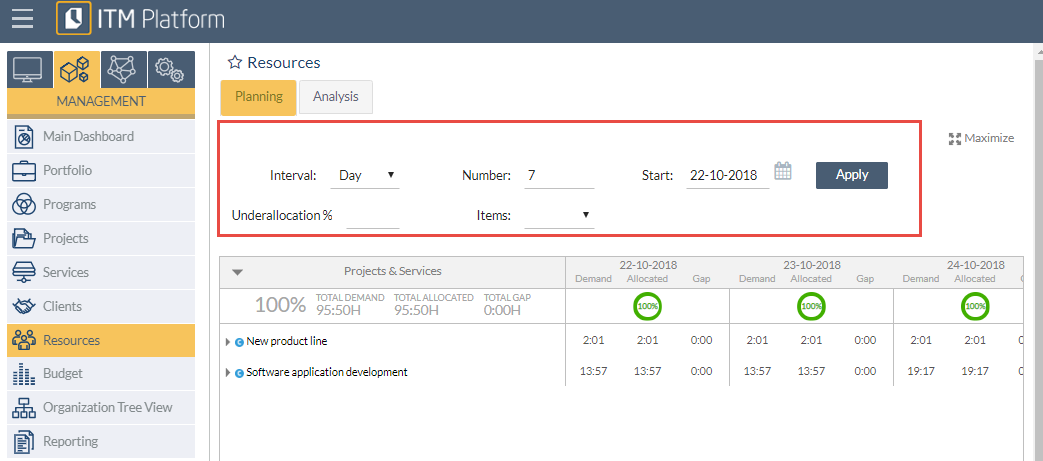
Selecting a period
The top of the screen includes the filters to set the range of the date you want to view on the resources screen. The demand and capacity can be viewed in four different intervals: day, week, month and quarter.
Note: The maximum number of intervals is 31 for days, weeks and months and 8 for quarters.
By selecting the start date you set at which day the first interval should start. To apply these settings, click the Apply button.
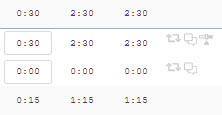
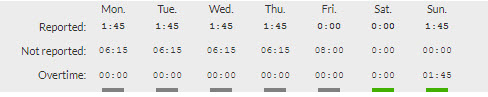
The Underallocation % field allows to set the threshold that will highlight in green the underallocation of resources in the below panel of the screen.
Example: If the total capacity of a resource in a period is 100 hours and 60 hours have been allocated, they will have a 40 percent underallocation. By setting the “Underallocation %” field to 35, the availability will be highlighted in green.
Finally, the field on the far right is used to set the number of rows you wish to display in each section.