Revenue Recognition

Introduction to Revenue Recognition

Revenue Recognition is part of the Project Revenue Management feature in ITM Platform, which includes plan revenue, recognize revenue, actual revenue processing, and perform project account closure and financial analysis within the project life cycle.

Revenue recognition is an accounting principle that identifies the specific conditions in which revenue is recognized. The revenue recognition concept is part of accrual accounting and establishes that revenue should be recorded when it has been earned, not received.

Revenue versus cash timing:

  • Accrued revenues are used for transactions in which goods and services have been provided, but cash has not yet been received.
  • Deferred revenues reflect situations in which money has been received, but goods and services have not been provided.

Recognition principles are extensively outlined in IFRS and U.S. GAAP.

ITM Platform provides the following project revenue recognition methods.

  • Percentage-of-completion
  • Linear Distribution by Milestones
  • Fixed Price per Period
  • Bill Rate per Estimated Hours
  • Direct Revenue Recognition

The revenue recognition feature will distribute the total project revenue budget within the different periods of the project. Each method will use different formulas to calculate revenue recognition for each period.

You can choose to apply the same method for all projects in your company, specify a method per project type, or specify the method project by project. Before describing each of the methods, let us clarify the concepts of periods, actuals, forecast, amounts, percentages, how they apply to projects and how they affect revenue recognition.

Periods

Intuitively, you can tell a period is a range of time between two dates. ITM Platform identifies periods as days, weeks, or months. Months are more generally used for accounting and financial analysis purposes.

When a project is created, so are the periods. For example, say a project starts on November 15th and ends on February 10th. It will have four periods: November, December, January, and February.

Whenever a Revenue Recognition is made, it will apply to one period. Therefore, you will be able to recognize revenue for each month, using the method of your choosing.

Actuals and forecast

When you select a revenue recognition method, establish a revenue budget, and set the project start and end dates, the system will automatically create a forecasted revenue recognition per period.

Forecasted revenue recognition is the expected revenue recognition for a future period. The forecast can use the revenue recognition method applied to the project or, if you configure it that way, it can just make a homogeneous distribution along all periods.

Once forecasts have been calculated, you can create an actual revenue recognition, starting with the first period.

Actual revenue recognition is usually applied to past periods and represents the revenue that has been recognized.

Amounts and percentages

Whenever revenue recognition is made, it will generate four relevant values per period: amount and percentage both for the period and accumulated to the project.

Let’s see an example:

The project has a revenue budget of 100,000 $ and has four periods. Let us assume each period will have the same revenue recognition of 25,000 $ each.

  • Revenue recognition amount for the period: the amount of money recognized on the period. In our example, this will be 25,000 $.
  • Accumulated revenue recognition amount: the amount of money recognized from the beginning of the project until that period. On the third period, it will be 75,000$
  • Revenue recognition percentage for the period: the proportion of the revenue recognition amount for the period over the total revenue budget. In our case, 25%
  • Accumulated revenue recognition percentage: the proportion of the accumulated revenue recognition amount for that period over the total revenue budget. On the third period, it will be 75%


Revenue Recognition Methods


Percentage-of-completion

This method calculates revenue recognition multiplying the project progress during the period by the total revenue budget.

Linear Distribution by Milestones

This method is based on “Revenue Milestones”. The value of each milestone is the proportion of its estimated hours within the project, multiplied by the total revenue budget

As opposed to the percentage-of-completion method, each milestone will consider a linear distribution of progress along time and will apply that percentage to-date to the milestone value, regardless of the progress reported.

To use this model, you need to create “Revenue Milestones” within the project plan. They are created equal to regular milestones but should also be marked as “Revenue Milestone” within the milestone’s general tab.

In the Gantt Chart, you should then set the milestone’s dependencies with the task you want to use in the revenue recognition of each revenue milestone. To include multiple tasks in the milestone’s revenue recognition, you have to create a summary task with those tasks and establish the dependency between the summary task and the milestone.

Fixed Price per Period

This method will divide the total revenue budget by the number of periods within the project, applying the same revenue recognition amount per period.

Bill Rate per Estimated Hours

This method recognizes the revenue as the result of multiplying the bill rate per professional category by the estimated hours of each task, factoring in the progress task as the proportion for that period.

Direct Revenue Recognition

This method recognizes all revenue, regardless of their status.


Getting Started with Revenue Recognition

Configuration


There are three locations where you can set your preferences for revenue recognition, from a higher level to the project itself:

  1. For the whole company, in Configuration → Project Parameters → Methods
  2. By project type, in Configuration → Project Parameters → Project Type.
  3. By project, in the General section of the project. This option will only be available if the option “Allow project settings to override this configuration” was ticked at the company level

Regardless of the level at which you configured the settings, these are the options you can configure:

  • Revenue Recognition Method: any of the methods offered by ITM Platform.
  • Forecast Recognition Method: use the same as Revenue Recognition Method or create a linear distribution over the future periods.
  • Revenue Recognition Periods: Months or weeks.
  • Whether the actual revenue recognition amount can be manually changed or not.

Project requirements to work with revenue recognition


Once you have chosen the options that best meet your needs, make sure your project has the necessary information:

  • Your project has both start and end dates. Otherwise, the system will not be able to create the periods.
  • Your project has a total revenue budget. You can set this value in the Budget section of the project, clicking on the “Edit Top-Down Budget” button.

Accessing the revenue recognition feature


If your project meets the requirements, it will show a new “Revenue Recognition” section under “Revenue”

There are two main subsections on this page:

  • Summary, which provides with condensed and graphical data about the current revenue recognition status
  • Revenue Recognition Periods, which will display a list of all actual and forecasted revenue recognition periods
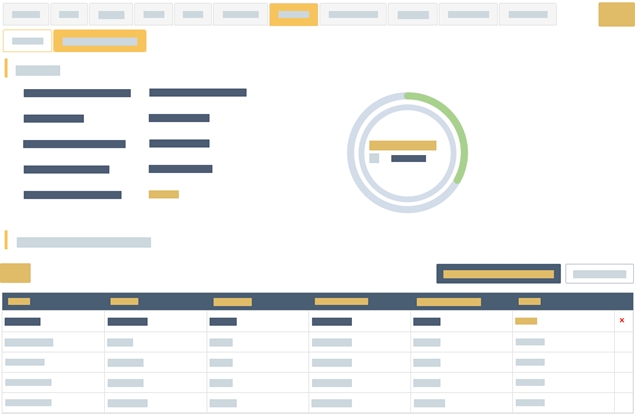
The button “Add New Revenue Recognition” button will convert the next forecasted revenue recognition into actual revenue recognition.

You will be able to add a description and, if it was configured that way, change the period amount.

Once you save, the line will turn into actual revenue recognition, and the next forecasted period will be next to become actual.

Actual revenue recognitions can be deleted from the list in the reverse order they were created. A user with enough permissions can lock actual revenue recognition lines, so they cannot be changed or deleted.



Iterations in API calls to ITM Platform with Excel and Power Query

Iterations in API calls to ITM Platform with Excel and Power Query

When using the API, sometimes you have to make a call for each record from a previous query. For example:

  1. Getting the project list
  2. To get the budget for each project, you will need to get all project budgets from the list above

Here is the conceptual schema of the calls:

Step 1: Identifying methods and basic access to the API

For everything about basic access to the ITM Platform API, you can refer to the first part of this guide: In the case of the example used in this article, it is necessary to use three methods. The first two had already been used to access ITM Platform and generate the project list.

  1. Authentication
  2. Budget for each project
  3. Based on the query in the previous article, only the ProjectID and ProjectName columns are selected. The result is a correctly identified list of projects.

To verify that the query is correct, the advanced editor should display code with a structure similar to that of the example:

let
    myToken = Json.Document(Web.Contents(«https://api.itmplatform.com/company/login/elon.musk@itmplatform.com/12345»)),
    Source = Json.Document(Web.Contents(«https://api.itmplatform.com/company/projects/?ProjectStartDate=lt:2017-05-08T00:00:00Z&ProjectEndDate=gt:2017-05-06T00:00:00Z», [Headers=[token=myToken[Token]]])),
    #»Converted to Table» = Table.FromList(Source, Splitter.SplitByNothing(), null, null, ExtraValues.Error),
    #»Expanded Column1″ = Table.ExpandRecordColumn(#»Converted to Table», «Column1», {«ProjectID», «ProjectName»}, {«ProjectID», «ProjectName»}),
in
    #»Expanded Column1″

Step 2 – Create the second query and make it a function

The second query in the example retrieves the detailed budget for each project.
The query is made according to the same procedure, with a significant difference: the URL varies by call:
https://api.itmplatform.com/company/projects/{ProjectID}/budget
In other words, you have to replace the value of the project with its value: the ID of each project. To do this automatically, you need to create a new query and transform it into a function. The syntax is very similar.
Note: Before proceeding, you should change the privacy level of the current workbook to “none” in the privacy options of the Power Query options. Otherwise, there might be errors when combining queries.

  1. Creating a blank query
  2. Creating the function. See syntax:
    (p_id) =>
    let
        myToken = Json.Document(Web.Contents(«https://api.itmplatform.com/company/login/elon.musk@itmplatform.com/12345»)),
        Source = Json.Document(Web.Contents(«https://api.itmplatform.com/company/projects/»& Number.ToText(p_id) & «/budget», [Headers=[token=myToken[Token]]]))
    in
        Source
    

Differences with generic queries:

  • at the beginning it opens with:
    (p_id) =>

    This formula indicates that a function will replace Number.ToText(p_id) in each URL it generates with the project ID.

  • When you save the query, the system indicates that it is a function. In this case, it is named “Budget”

Step 3 – Join the above steps

Once the function is created, you need to go back over the initial query to:

  • Add a column as a custom function
  • Choose the newly created feature
  • Choosing the ProjectID column as a parameter

The rest of the steps are the usual:

  • Expand the columns to select the ones that are of interest
  • Add convenient custom columns
  • Save and use any of Excel’s data exploitation media, such as PowerPivot.
    The example added two custom fields:
  • Total Budget
  • Actual cost
    The two fields have been compared to a bar chart.

Note: If the result of the first table contains many records, calls to the second query may be delayed, as many qeries will be made as there are records. Try to narrow your search to what interests you.

<style><!-- [et_pb_line_break_holder] -->pre.code {<!-- [et_pb_line_break_holder] --> background: #f4f4f4;<!-- [et_pb_line_break_holder] --> border: 1px solid #ddd;<!-- [et_pb_line_break_holder] --> border-left: 3px solid #f36d33;<!-- [et_pb_line_break_holder] --> color: #666;<!-- [et_pb_line_break_holder] --> page-break-inside: avoid;<!-- [et_pb_line_break_holder] --> font-family: monospace;<!-- [et_pb_line_break_holder] --> font-size: 14px;<!-- [et_pb_line_break_holder] --> line-height: 1.4;<!-- [et_pb_line_break_holder] --> margin-bottom: 1.6em;<!-- [et_pb_line_break_holder] --> max-width: 100%;<!-- [et_pb_line_break_holder] --> overflow: auto;<!-- [et_pb_line_break_holder] --> padding: 1em 1.5em;<!-- [et_pb_line_break_holder] --> display: block;<!-- [et_pb_line_break_holder] --> word-wrap: break-word;<!-- [et_pb_line_break_holder] -->}<!-- [et_pb_line_break_holder] --></style>

Risk & Issue Management

Main concepts used in this document

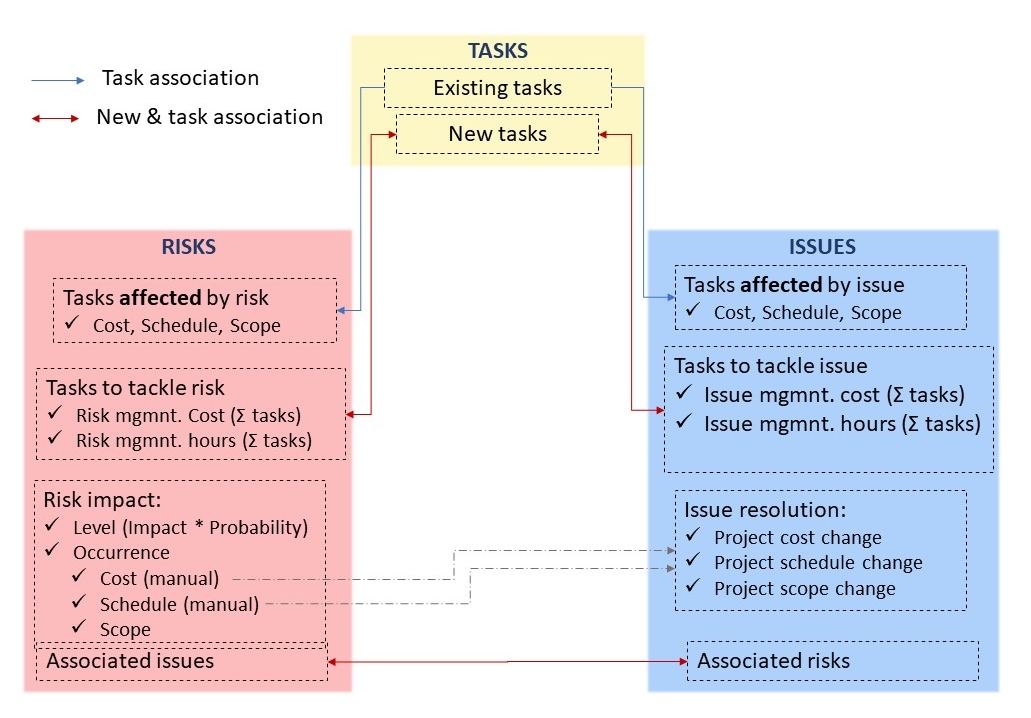
  • A risk is a potential future event that could have a negative impact on a project.
  • The risk level is determined by the probability a risk will occur and the impact it will have. Both of these are parameters which can be configured.
  • By applying a mitigation plan, we reduce the probability of the risk occuring.
  • When we create a contingency plan, we do not change the probability of the risk occuring, but we plan for how to control the impact if it does so.
  • An issue is an event that affects the project. When the risk mitigation plan fails, you can escalate the risk to an issue.
  • Issues can be of different natures. ITM Platform provides for three predefined types of issue:
    • A problem, an unexpected fact that affects predictions for the project or service delivery
    • A change request, adjustment to the specifications, affecting the project deliverable
    • A bug, problem that affects the functionality of the service or product
  • Tasks affected by the risk: existing tasks jeopardized by the risk, and how: scope, budget or schedule.
  • Tasks to tackle the risk: tasks created to manage, mitigate, or act on the contingency plan.
  • Tasks affected by the issue: existing tasks affected by the issue, and how: scope, budget or schedule.
  • Tasks to tackle the issue: tasks created to solve the issue.
  • The risk or issue manager: the person in charge of monitoring the risk or dealing with the issue. Tasks to tackle risks or issues may also have their own managers and team members.
  • Issue resolution: Set of data that reflects how the issue was solved or dealt with. It includes changes in the project cost, schedule or scope.

This is a general overview of what we will explain in the next sections.

Settings

ITM Platform comes with predefined settings that allow you to start using risk and issues feature right away. If you need to change the configuration go to the CONFIGURATION menu tab, PARAMETERS section.

Risk Parameters

The most relevant section under risk parameters is on the Risk Level tab.

There you can modify the risk impact values or create new ones. For example, high, medium-high, medium-low, and low.

The second parameter is the risk probability, which, similarly to the risk impact, has values that can be customized to meet your needs.

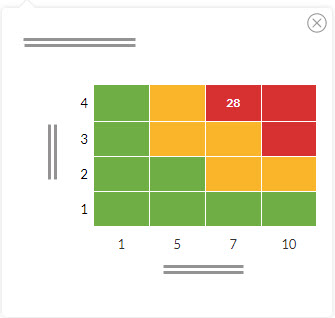
Finally, the risk level section allows a company to define its own thresholds for the preset high, medium, and low levels. The risk level will be calculated by multiplying the impact by the probability, resulting in one of the existing risk levels.

For example, let’s assume the threshold to reach the medium risk level is 25 and high is 35. If a risk as an impact of 4 and a probability of 7, the resulting risk level will be 28. Therefore, medium.

In addition to the risk level, impact and probability, you can customize the risk status and the risk type.

Issue Parameters

The issue type will help you identify the nature of the issue – as well as classifying any changes to the costs and schedule by type. ITM Platform comes with three predefined types: change request, bug, and problem. You can add to, edit, or remove these.

The issue status allows you to determine whether it is an ongoing issue or it has been resolved. There are two predefined statuses: open and closed. You can add more types of statuses if you need. These will be used as a flag for your dashboards and reports.

Risks

Risks can be found under the ‘Risk & Issues’ section of a project, Risks subsection.

The initial layout of the risk registry will be the ‘Graph View’, which allows you to understand the risk map visually.

Here, you can edit, add or delete risks, as well as establish the impact and probability values to update the risk level dynamically.

Below the risk level indicator, there is a button that will show you the risk matrix.

On the vertical axis of the table you will see the probability displayed and on the horizontal axis, the impact. The risk level is the result of multiplying both values and is represented where the two cross.

If you select the ‘List View’ on the risk registry, all the traditional list options in ITM Platform are available, such as filtering, columns selection, or export to Excel.

The risk file

When editing a risk, you will find the following sections:

General

It allows you to classify the risk and give it a name. Also, a risk number will be provided.

Potential Impact on Project

This section holds information related to the impact the risk is likely have on the project if it materializes.

Here you will find the Risk occurrence sub-section. This allows you to indicate the potential cost variation, schedule variation in days, and a description of the potential change in scope.

The third and last subsection is Tasks Affected by this Risk, which allows you to select existing tasks that will be particularly affected by the risk. For each task, you can indicate how it will be affected: cost, budget, or scope.

Risk management

This section holds the information related to how the risk is being handled. The first part of it will allow you to select a risk manager and define both mitigation and contingency plans. You can also attach any related documents.

You can select existing Tasks to Tackle Risk or create new ones. These are specific tasks created to manage the risk and are not the ones affected by it.

In this subsection, you will also find the Total Cost of Risk Management and Total Hours of Risk Management. You can specify a value for each one of them, or you can click on the option to ask the system to use the cost and hours from the Tasks to Tackle Risk.

Associated Issues

As previously said risks can escalate to become an issue. In this section, you can create or select existing issues to associate with the risk.

Issues

Issues may come up as a result of a previously identified risk or be completely independent.

The anatomy of an issue is very similar to that of a risk: it includes a General section, Tasks Affected by the Issue, Tasks to Tackle Issue, and Associated Risks.

In the General section, the Issue Status is particularly relevant, since the information you will find on dashboards and reports will be classified between closed and non-closed issues.

Issue Resolution

This section is usually filled out when the issue has been closed. It includes a final resolution description that can be extended by adding documents.

Change in Project Cost will indicate the economic impact this issue had on the project. This figure can be typed manually or else you can click on the option to use the risk’s occurrence cost if there are any associated risks. The same goes for variations in schedule.

Dashboard

The project dashboard offers the following dashlets

Total cost of risk management

  • Type: Pie
  • Total: total cost of project + Total cost of risk management
  • 2 slices
  • Number (formatted) and percentage
  • Applies to all risks, open and closed

Total cost of issue management

  • Type: Pie
  • Total: total cost of project + Total cost of issue management
  • 2 slices
  • Number (formatted) and percentage
  • Applies to all issues, open and closed

Total schedule variation of risk occurrence

  • Type: Horizontal bars
  • Bar 1: Total duration of project
  • Bar 2: Total variation of project (+/-) Σ total durations of risk occurrence
  • Number (formatted) and percentage
  • Applies to non-resolved risks

Total cost of change for closed issues

  • Type: Pie
  • Total: Total cost of project + Total cost of change for closed-status issues
  • 2 slices
  • Number (formatted) and percentage
  • Applies to closed issues
  • Total schedule variation for closed issues

    • Type: Horizontal bars
    • Bar 1: total duration of project
    • Bar 2: total duration of project (+/-) Σ total durations of schedule change
    • Number (formatted) and percentage
    • Applies to closed issues

    Total cost of issues by type

    • Type: pie
    • Total: total cost of closed issues
    • As many slices as issue types
    • Number (formatted) and percentage
    • Applies to closed issues

Single Sign-on (SSO)

Single Sign-On (SSO)

Introduction

Single Sign-On (SSO) is a session and user authentication service that permits a user to use one set of login credentials (i.e, name and password) to access multiple applications.

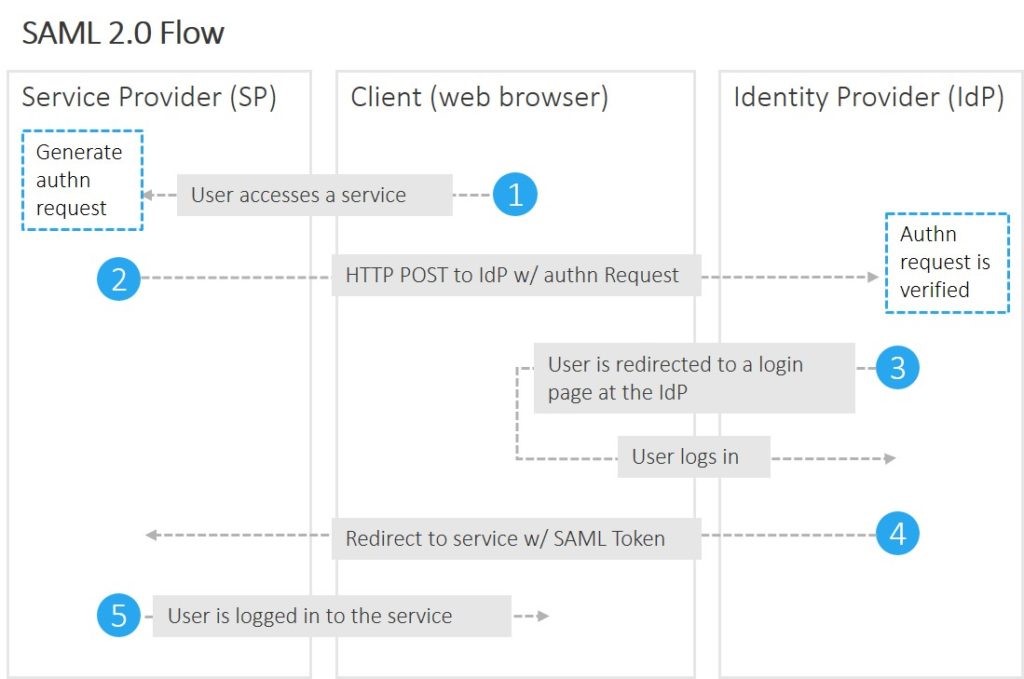
Single Sign-On can be enabled in your company account by request. When enabled and configured, users can access ITM Platform with their corporate credentials. Once you have Single-Sign-On, the username and password for the user are managed by the identity provider (IDP) of the user’s company or a third party SSO solution.

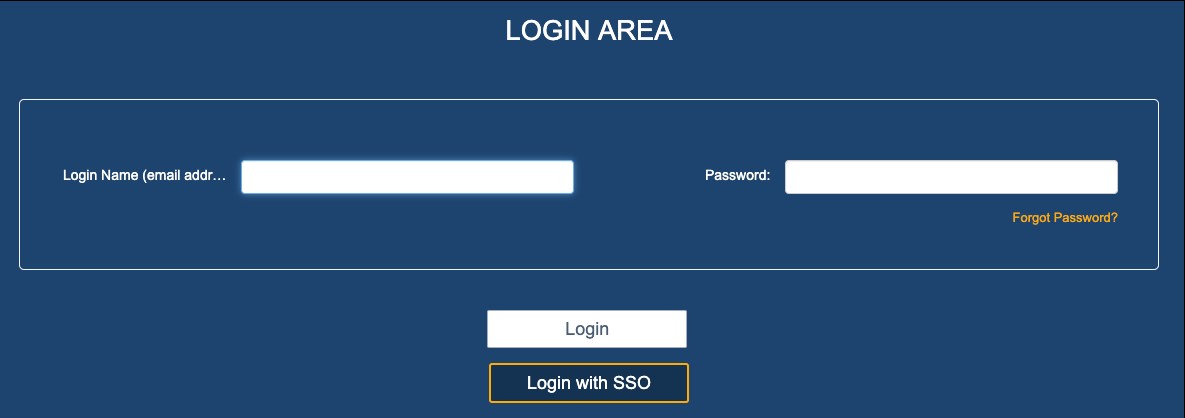
For the user, this means if they access Single-Sign-On from the ITM Platform login page they will be redirected to a login page provided by their own company. If authentication is successful, the user will be sent back to ITM Platform and logged in.

Characteristics of using Single-Sign-On at ITM Platform

The Single-Sign-On at ITM Platform has the following characteristics:

  • ITM Platform supports SSO based on SAML 2.0, which includes solutions like Microsoft ADFS, Office 365 / Azure AD, Auth0.
  • The e-mail address that is used at the IDP should be identical to the e-mail address of the ITM Platform user. As a minimum, the e-mail address should be included within the manifest.
  • When using SSO with ITM Platform, users need to be created in both ITM Platform and at the IDP server. User roles and permissions in ITM Platform also need to be configured in ITM Platform.
  • SSO can be made either optional or mandatory from the Company Settings Page.
  • When a user is blocked at the IDP, they will not be able to log on in ITM Platform using SSO.
  • Once enabled, the SSO configuration can be modified by any Full Access user.

Setting up SSO

If you want to enable SSO in your ITM Platform account, please contact ITM Platform support. Once enabled, please follow the steps listed below to set up your SSO.

Configuration at your company´s IDP/SSO provider

To add ITM Platform as a service provider, you typically need to add an SSO application to your SSO solution.

Depending on the type of SSO solution, the exact names/terms can vary when it comes to information that is requested. To set up the application, complete the following details:

Setup of ITM Platform

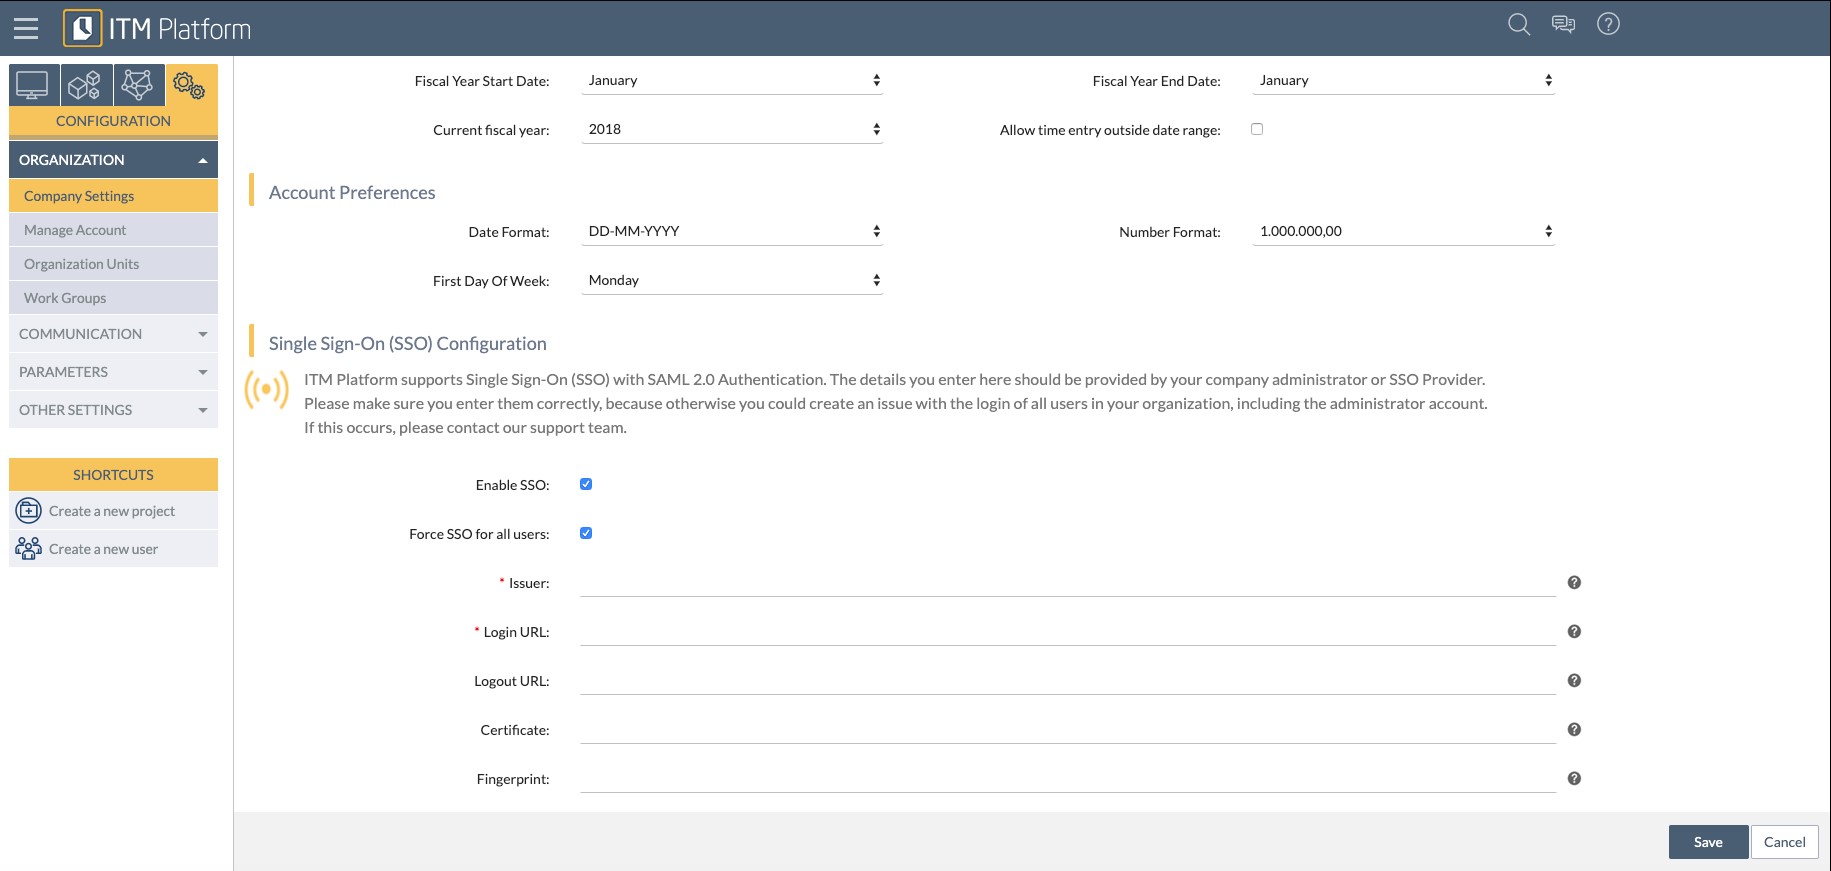
Browse to Configuration – Organization – Company Settings and scroll to the bottom of the Company Settings page.

Fill in the required fields:

  • Force SSO for all users: when this setting is enabled, Single-Sign-On will be the only and mandatory option for all users in your organization. When this setting is disabled, users can choose whether to use the regular ITM Platform login or use SSO by clicking the button “Login with SSO” at the ITM Platform login page.
  • Issuer: same as the Application ID URI/Issuer ID provided during the setup on your SSO solution
  • Login URL: corresponds with the SSO login page of your company. This value should be provided by your company admin or SSO provider.
  • Logout URL: this value is only necessary if you would also like to logout of your SSO provider when logging out of ITM Platform. Therefore, this setting is optional. The value should be provided by your company admin or SSO provider.
  • Certificate: this setting is optional but should be completed if you either want to encrypt the communication between the ITM Platform Service Provider (SP) and the IDP or when it is mandatory with the IDP. The certificate should be provided by your company admin or SSO provider.
  • Fingerprint: this setting is required when using a certificate. The fingerprint should be provided by your company admin or SSO provider. You can also use a fingerprint generator like https://www.samltool.com/fingerprint.php to generate it from the certificate,

Once you are sure that all settings are correct, enable the tick-box “Enable SSO” and save. Please note that if you provide an incorrect Login URL and have enabled the setting “Force SSO for all users”, you will not be able to log in to ITM Platform. Therefore, we recommend testing the settings first without this option enabled.

Tracking projects based on Agile Methodology

Tracking projects based on Agile Methodology

Index

The following article explains tracking progress in projects managed with Agile methodology.

Unlike tracking the progress in waterfall projects (Gantt), projects based on Agile methodology don’t have a required calendar projection, therefore the way to track progress differs from Waterfall.

In the “Progress” section of an Agile methodology project, you will find the following sections: Progress Report, Tasks by Type, and Charts / Diagrams.

Progress Report

The manual progress report makes it possible for the project manager to create a record that indicates the progress observed (% completed), as well as the evaluation (list of configurable values), a description, and a date.

This is useful when the progress of the project is not only represented by the consumption of tasks, but by the achievement of the deliverables of the project.

Task progress report by changing the task column

When you move a task to a completed column, you can configure the system so that its progress is increased to 100%, generating automatic progress report.

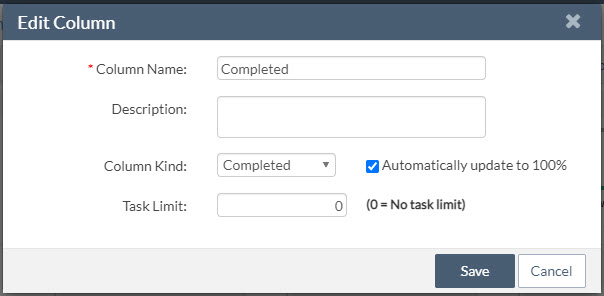
To configure this behavior in agile projects, access “Edit board layout”, edit the column of the type “Completed” that you want and tick the checkbox “Automatically update to 100%”

Thereafter, the tasks you mark as completed will be assigned 100% progress.

Note that if you roll back the status to a “Pending” or “In Progress” type, you will need to manually assign the new progress, if desired.

Tasks by type

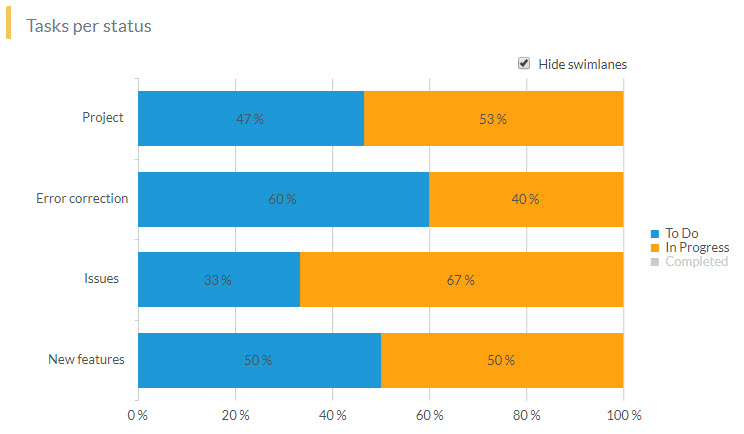
This chart represents the percentage of tasks in each status present in the project at this time.

The standard status types are “To Do”, “In Progress” and “Completed.” It is independent of the number of columns that the Agile board has because each column will be based on one of these three types.

Tasks per status can be seen in either the group or swimlane view.
You can also eliminate one of the statuses and in turn the chart will be recalculated based on 100 and display the remaining statuses.
In this example, we have removed the “Completed” status and now you see the composition of the backlog (Pending and In Progress).


Tracking Charts/Diagrams

This section provides two options: Burndown chart and Cumulative Flow diagram (CFD).

Both share the same filtering block which allows you to customize the displayed information according to your preferences.

Date Interval (start and end)

Determine the timeline the chart will represent.

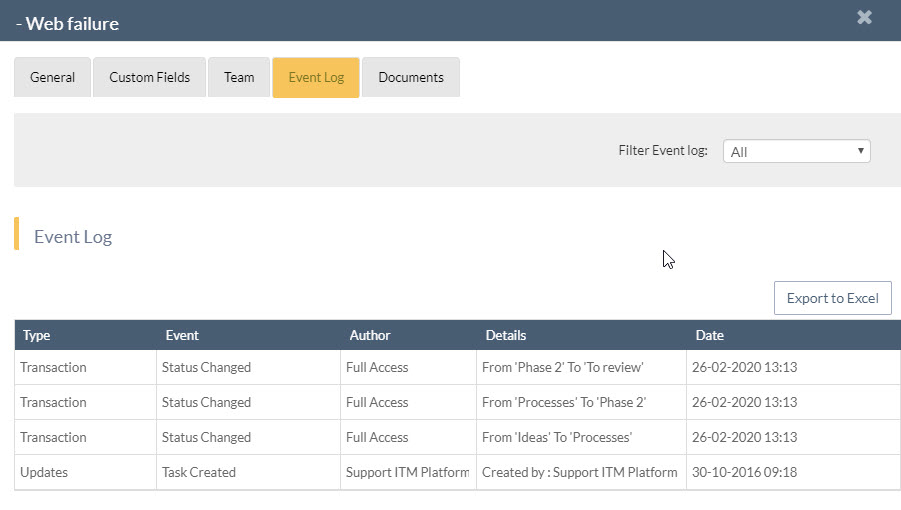
It is important to note that the dates that are reflected in the charts are those of the task status changes. That is, they are not the start or end dates of tasks.

You can view all date and status changes in the “Event Log” section of the task.

Default settings

  • The Cumulative Flow diagram will start on the creation date of the first task and end today.
  • In the Burndown chart, the chart corresponds to the start and end dates of the project.

Dates representing verticals (X-axis) are the result of dividing the period by 14, so that regardless of the temporal dimension of the chart, you will always have a homogeneous view. If the duration is less than 14 days, you will notice as many intervals as there are days.

Columns and swimlanes

You can choose to show or hide tasks that belong to:

  • Columns: Remember that each column has one of three types and these are the ones that are represented in the charts.
  • Swimlanes: either used as process types or sprints.

Burndown Chart

Represents the dynamics of tasks completed.

The Burndown chart is generally used when all tasks are determined from the beginning.
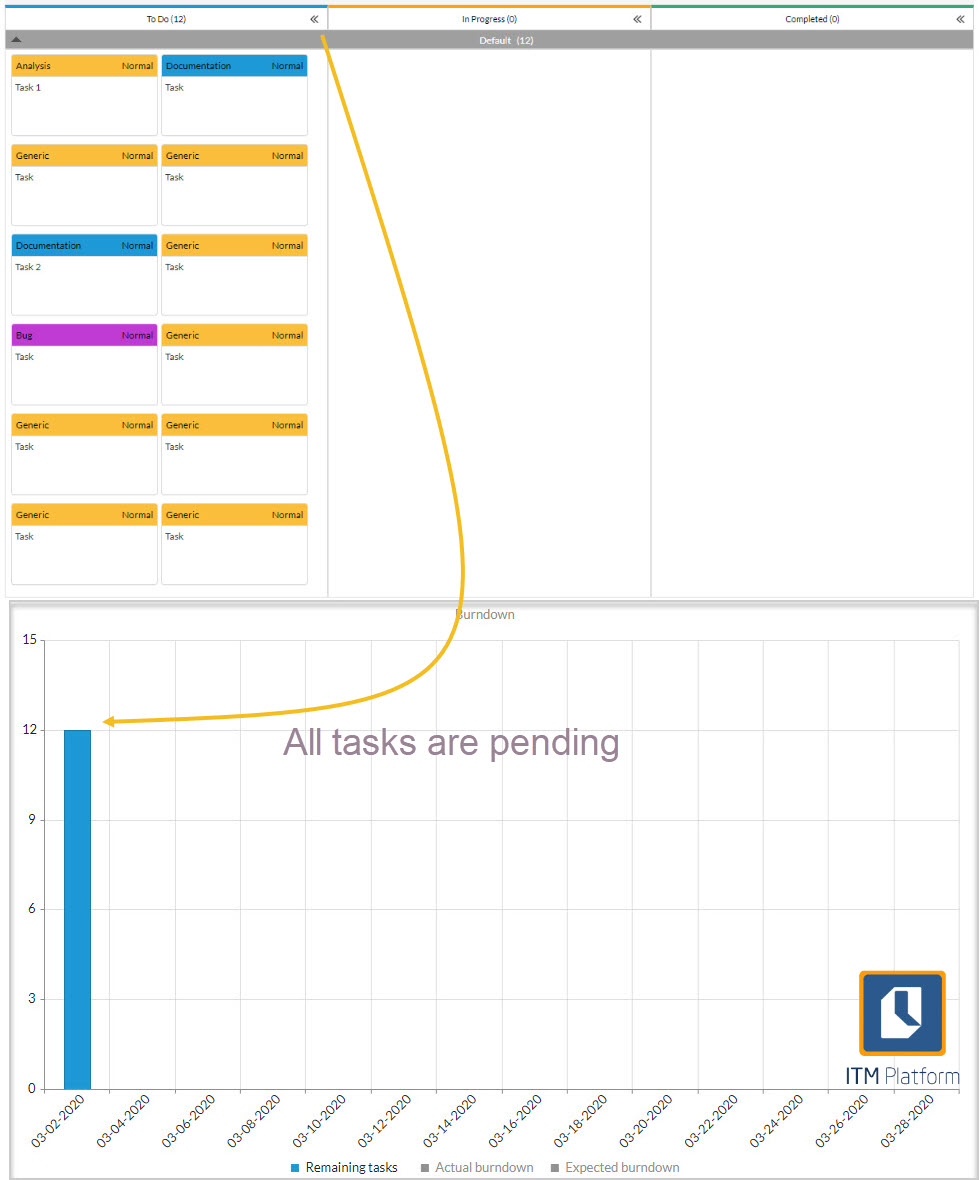
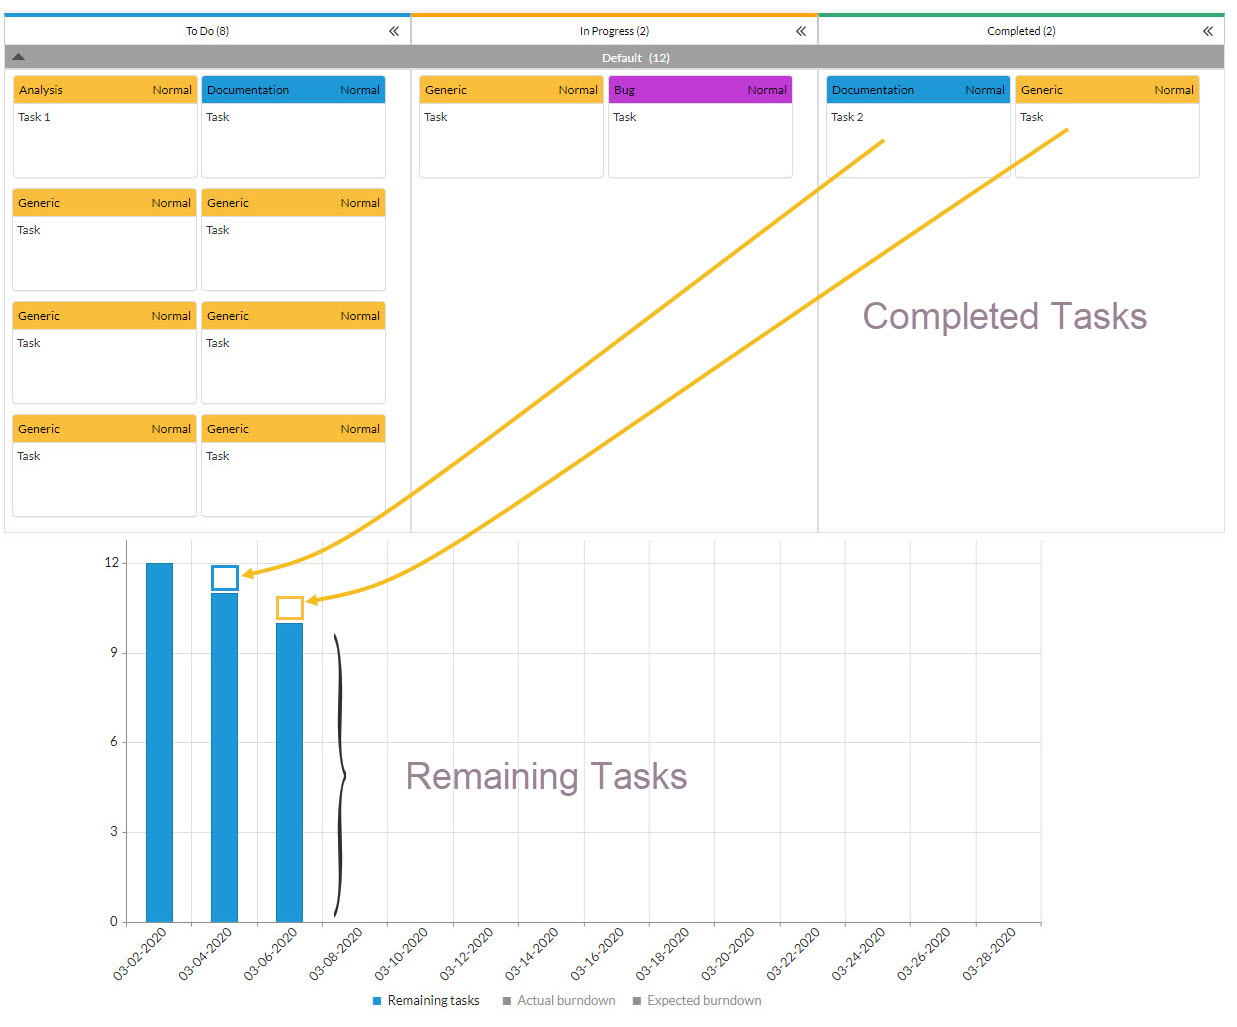
Let’s look at an example:

Notice that the backlog shows tasks that are created on the same day. Let’s see what happens if we move one to “Completed” status and another to “In Progress”.
If we follow the completion rate of tasks, we will eventually leave the work column pending to zero.
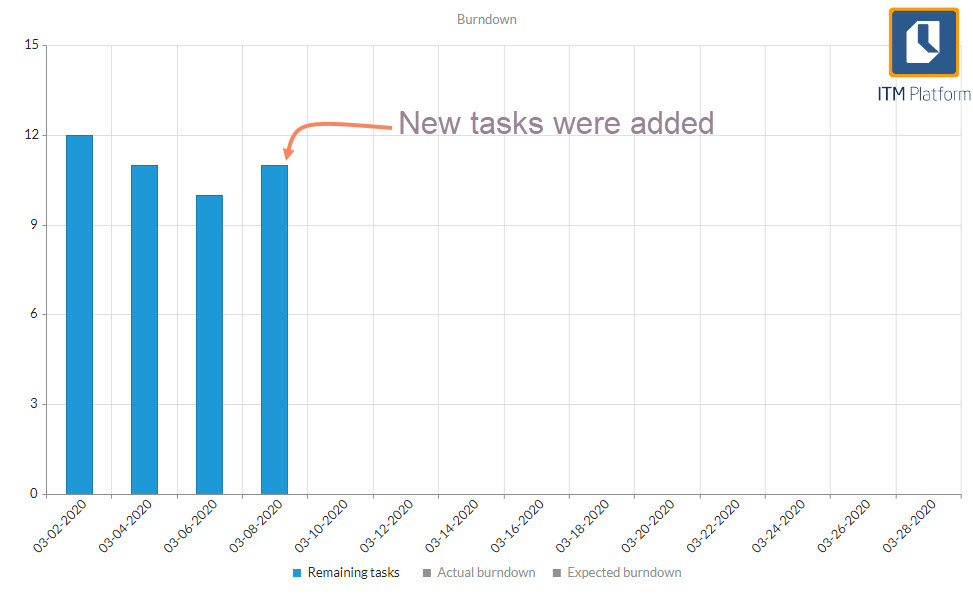
However, if we add “To Do” tasks as the project or sprint continues, we will notice anomalies in the trend because instead of reducing the backlog, it will increase.
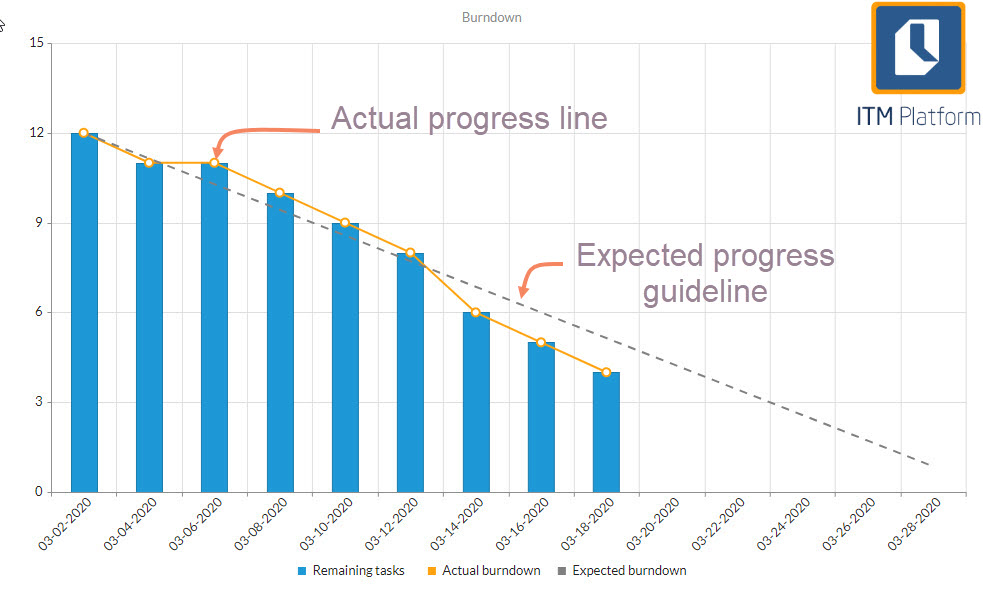
Expected line of progress

This is a straight line that connects the number of tasks in the “To Do” status on the Y-axis to the beginning of the interval on the X-axis at that point in time. At that point in time, there should be no pending (Y-axis =0), so it is steadily declining.

How to interpret: If the tasks are of similar size, the number of pending tasks should be represented by the expected progress line.

Actual line of progress

Represents the actual number of pending tasks on interval. That is, the overall pending tasks at the start minus those completed. We’ve explained this concept prior with bar chart example.

The slope of the progress line indicates the “velocity” and determines the number of tasks completed per time block (usually a sprint).

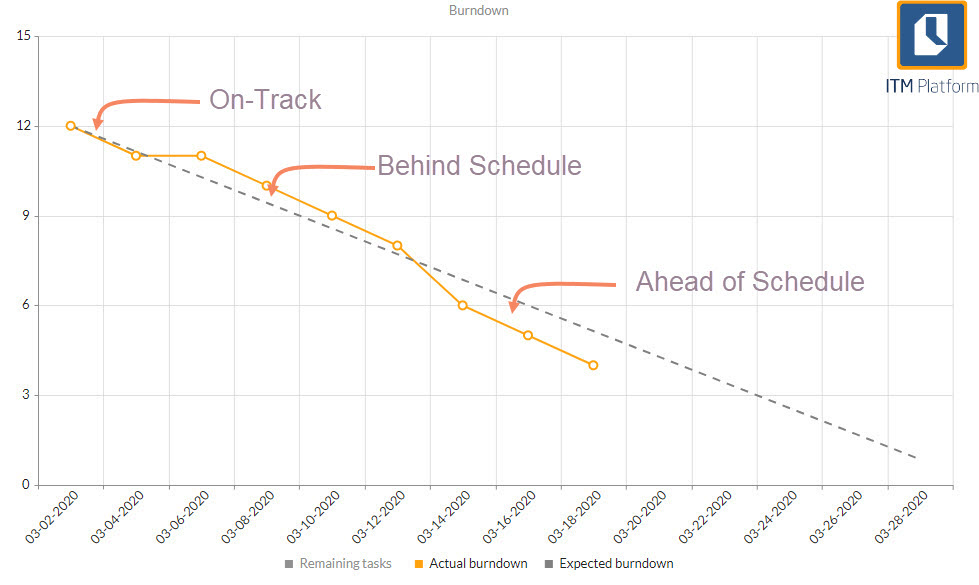
How to interpret a Burndown chart

On-track: The expected and actual line of progress are together. If it keeps this pace, the project will end in time.

Behind schedule: If the actual progress line is above the expected line, it means that the team is delayed and should have completed more work at this point.

Ahead of schedule: If the actual line of progress is below expected, it is progressing at a faster pace than expected. You can finish earlier than expected or add tasks. These interpretations are valid as long as the tasks are the same size, i.e. the time to solve them is similar.

Burndown Diagram Limitations

The Burndown diagram only represents the completed work. It reports the pending work, but it doesn’t reflect what is in progress.

Burndown works best on sprints or short projects and makes less sense with long-term projects. In long-term projects, pending work goes through many changes in order for the estimates to make any sense. This is the biggest reason why Burndown is not recommended for Agile methodology.

The Burndown diagram represents scope changes, as changes in the backlog are not displayed effectively.
These limitations are overcome by the Cumulative Flow Diagram.

Cumulative Flow Diagram (CFD)

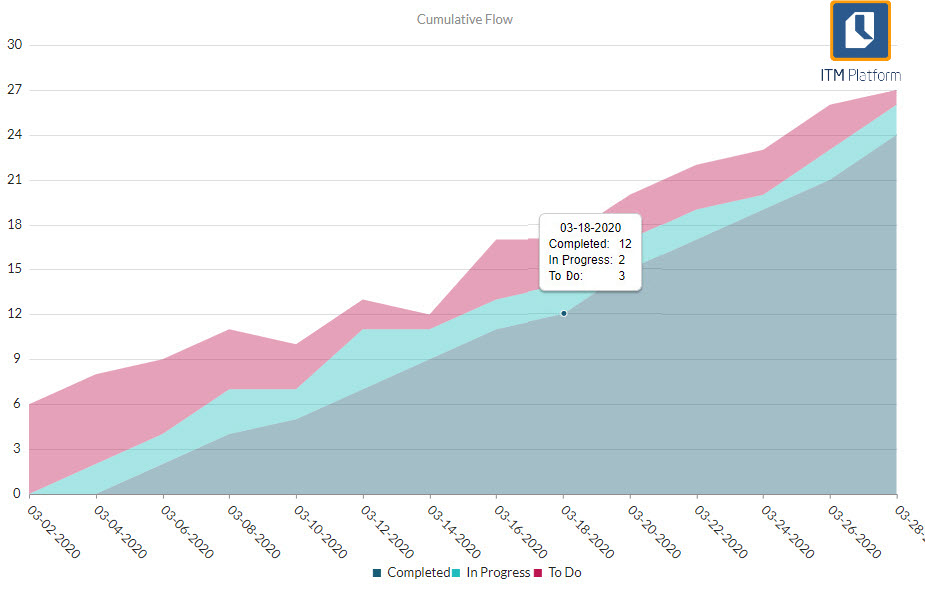
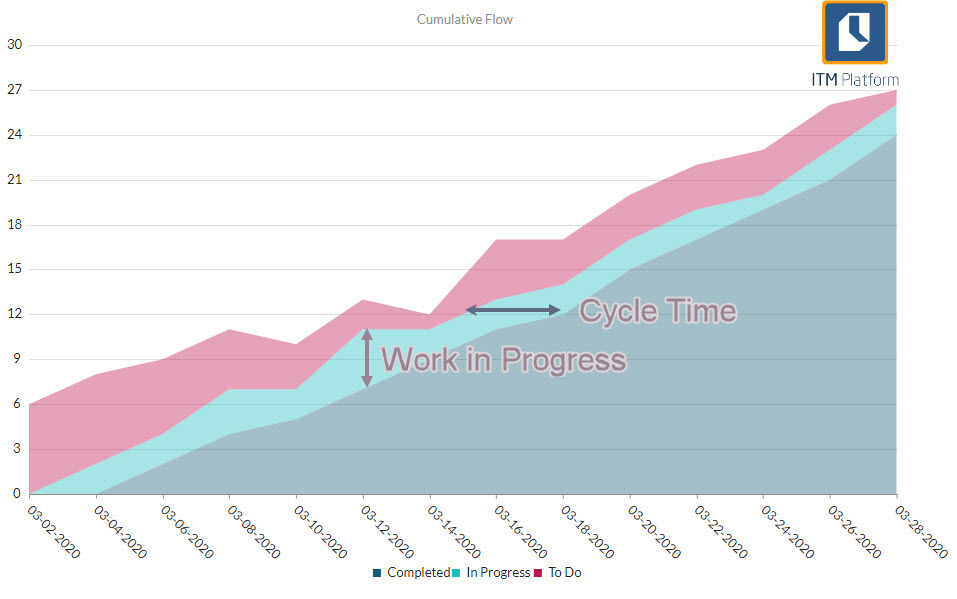
A Cumulative Flow diagram is a stacked area chart that shows, in each time interval, the number of tasks per status.

Reading the CFD

As you go along, the diagram shows the task flow by status. It is called “cumulative “because it does not measure increments between intervals but counts each element in each status, regardless of whether it was in that same status previously.

This way, it solves the main Burndown problem, as it represents situations in which to-dos are not all created on the first day.

The CFD provides two fundamental pieces of information in Agile management: Work in Progress (WIP) and Cycle Time (CT).

The “In Progress” bandwidth represents work in progress (WIP).

The space between time intervals provides Cycle Time (CT) represents the average time it takes a task to move from one status to another.

Limitations of the Accumulated Flow diagram

Despite solving the main limitations of the Burndown chart, the CFD has its own limitations.

• It does not reflect whether any task is blocked
• Related to the previous one, it does not indicate the individual cycle time, which means the amount of time that a particular task has remained in a single stage.

These limitations can be resolved through reports or custom views of tasks.