Hourly Revenue Management

Hourly Revenue Management


Contents:

ITM Platform’s Hourly Revenue Management feature enables automatic revenue calculation based on hours. This feature applies to both services and projects, offering flexibility in how revenues are estimated and billed.

Key concepts include:

  • Revenue Management: Overarching functionality for handling revenue, including Revenue Recognition.
  • Manual Revenue: Revenue manually added, without calculations.
  • Hourly Revenue: Calculated based on estimated or actual hours worked.
  • Non-billable hours: Time logged by users that doesn’t generate revenue.
  • Professional Category Override: A professional category that can be assigned to a user on a task instead of their default professional category.
 

Hourly Revenue


Hourly Revenue automates the process of generating revenue based on estimated or actual hours worked on a project or service. It enhances revenue management by allowing the user to switch between billing for tasks or resources while incorporating non-billable hours when necessary.


Key Concepts:


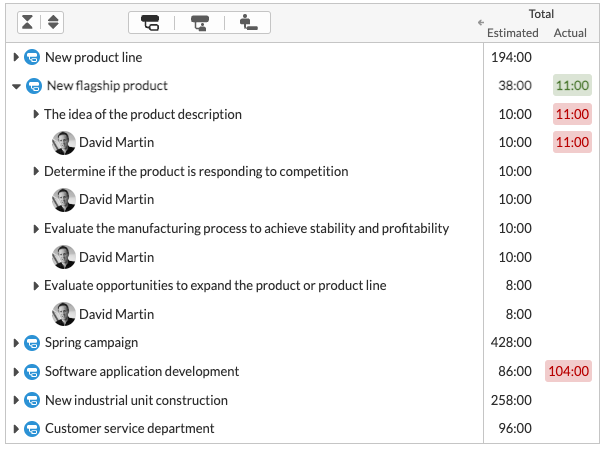
  • Estimated Hours: Used to predict revenues before actual work is completed.
  • Actual Hours: Reflects the actual effort spent and adjusts the revenue accordingly.

Project Configuration for Hourly Revenue


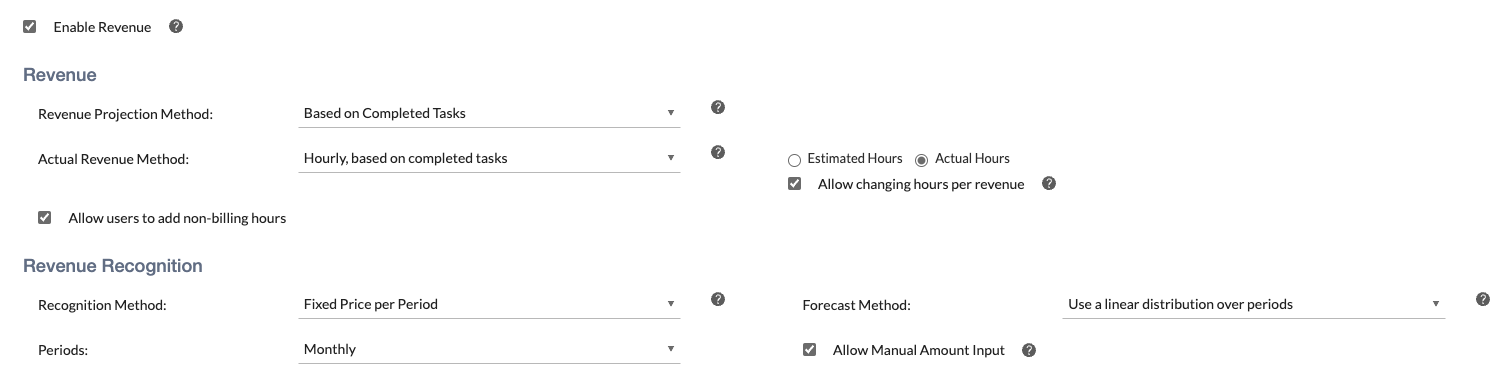
To enable hourly revenue for a project, follow these steps in the project’s General page:


  • Enable Revenue: This must be turned on for the project. If the actual revenue method is based on tasks or resources and revenues have already been created, this option will lock in and prevent future changes.


  • Select Actual Revenue Method: Choose between:
    • Manual Only: Requires manual input of amounts.
    • Based on Completed Tasks: Automatically calculates revenue based on completed tasks on the selected period.
    • Based on Resources: Calculates revenue based on hours logged by individual resources during the selected period.

After hourly revenue is generated, the method cannot be changed.

  • Estimated vs. Actual Hours: These options will be enabled if hourly revenue is based on tasks or resources. They set the default option when creating revenue.
  • Allow Changing per Revenue: This option permits the user who creates the revenue to choose between Estimated or Actual hours for that specific revenue entry.
  • Allow Users to Add Non-billing Hours: If this box is checked, users with permission can log non-billable hours for the project, with the effect that these hours are excluded from hourly revenue calculations.

Hourly Revenue Creation

The process of creating hourly revenue depends on whether the project is configured for tasks or resources:

  • Navigate to the Revenue section.
  • Click Create Hourly Revenue.
  • A popup will appear based on the project’s configuration, showing either completed tasks or resources for the selected period.
  • Select the billing month. If the project configuration allows, choose between Estimated or Actual hours.
  • Previously billed tasks or resources will be marked and cannot be billed again.

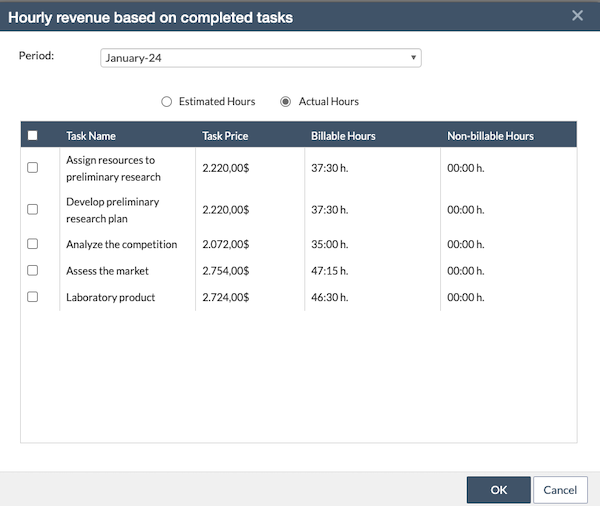
Billing Calculations

  • Based on Completed Tasks:
    • Estimated hours: Task price is calculated from the project category bill rate multiplied by the estimated hours for each task.
    • Actual hours: Task price is based on the project category rate, multiplied by the actual hours worked (excluding non-billable hours).
  • Based on Resources:
    • Estimated hours: Multiply the estimated hours logged by each user by the project category rate (applied to employees or providers).
    • Actual hours: The same calculation applies to actual hours worked, excluding non-billable hours.

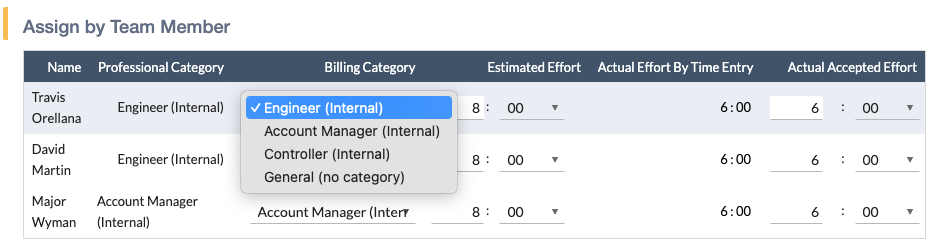
Assigning a Different Billing Category to a Task-User Assignment

To assign a different billing category to a user for a specific task:

  • Go to the Effort tab of the task.
  • In the Assign by Team Member section, a Billing Category column is available for each user. Initially, it matches their professional category.
  • Change the billing category for the task if necessary.
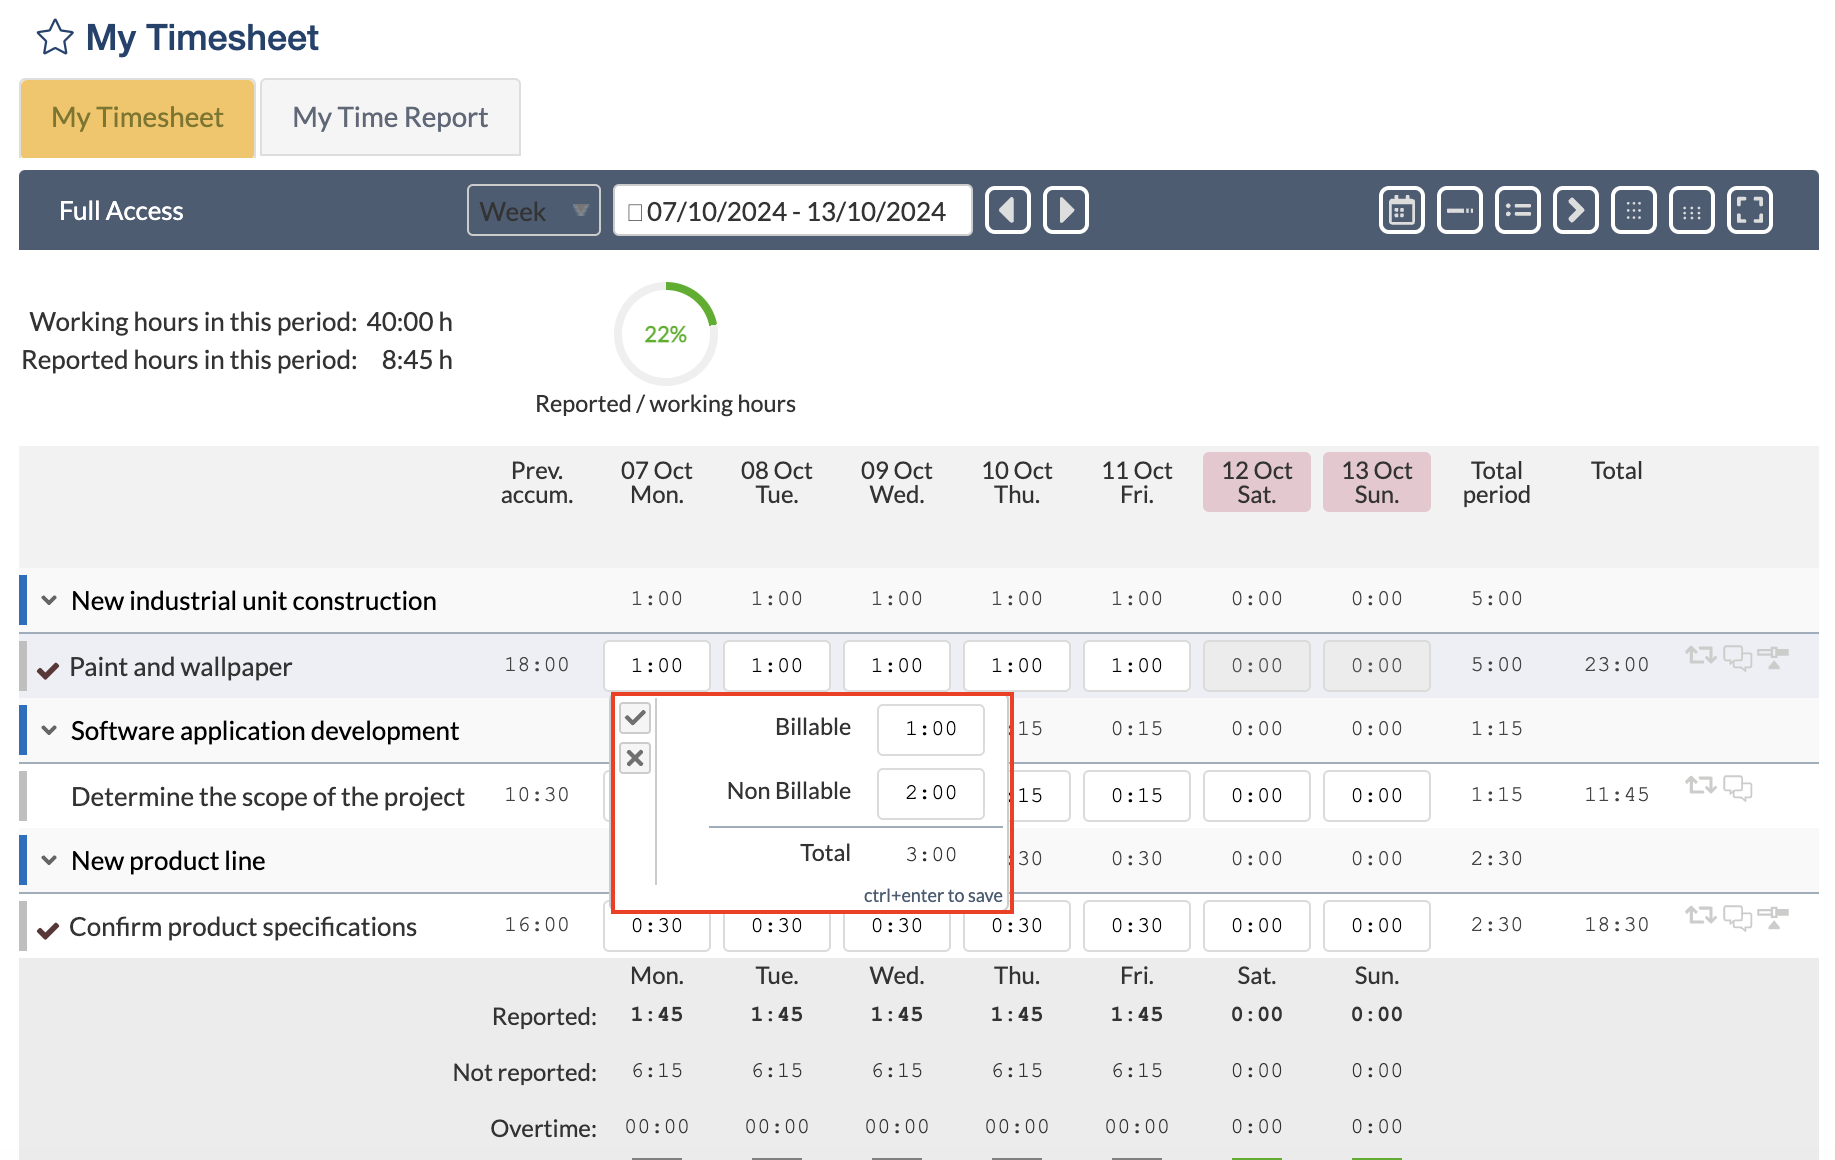
Non-billable Hours

Non-billable hours allow users to log time that will not be included in hourly revenue calculations when using Actual Hours.

Steps to enable non-billable hours:

  • Ensure the project has Allow Users to Add Non-billing Hours enabled.
  • Users with this permission will see options to log both billable and non-billable hours in the timesheet for each task.
  • Users can add notes about the logged hours in the Comments section.
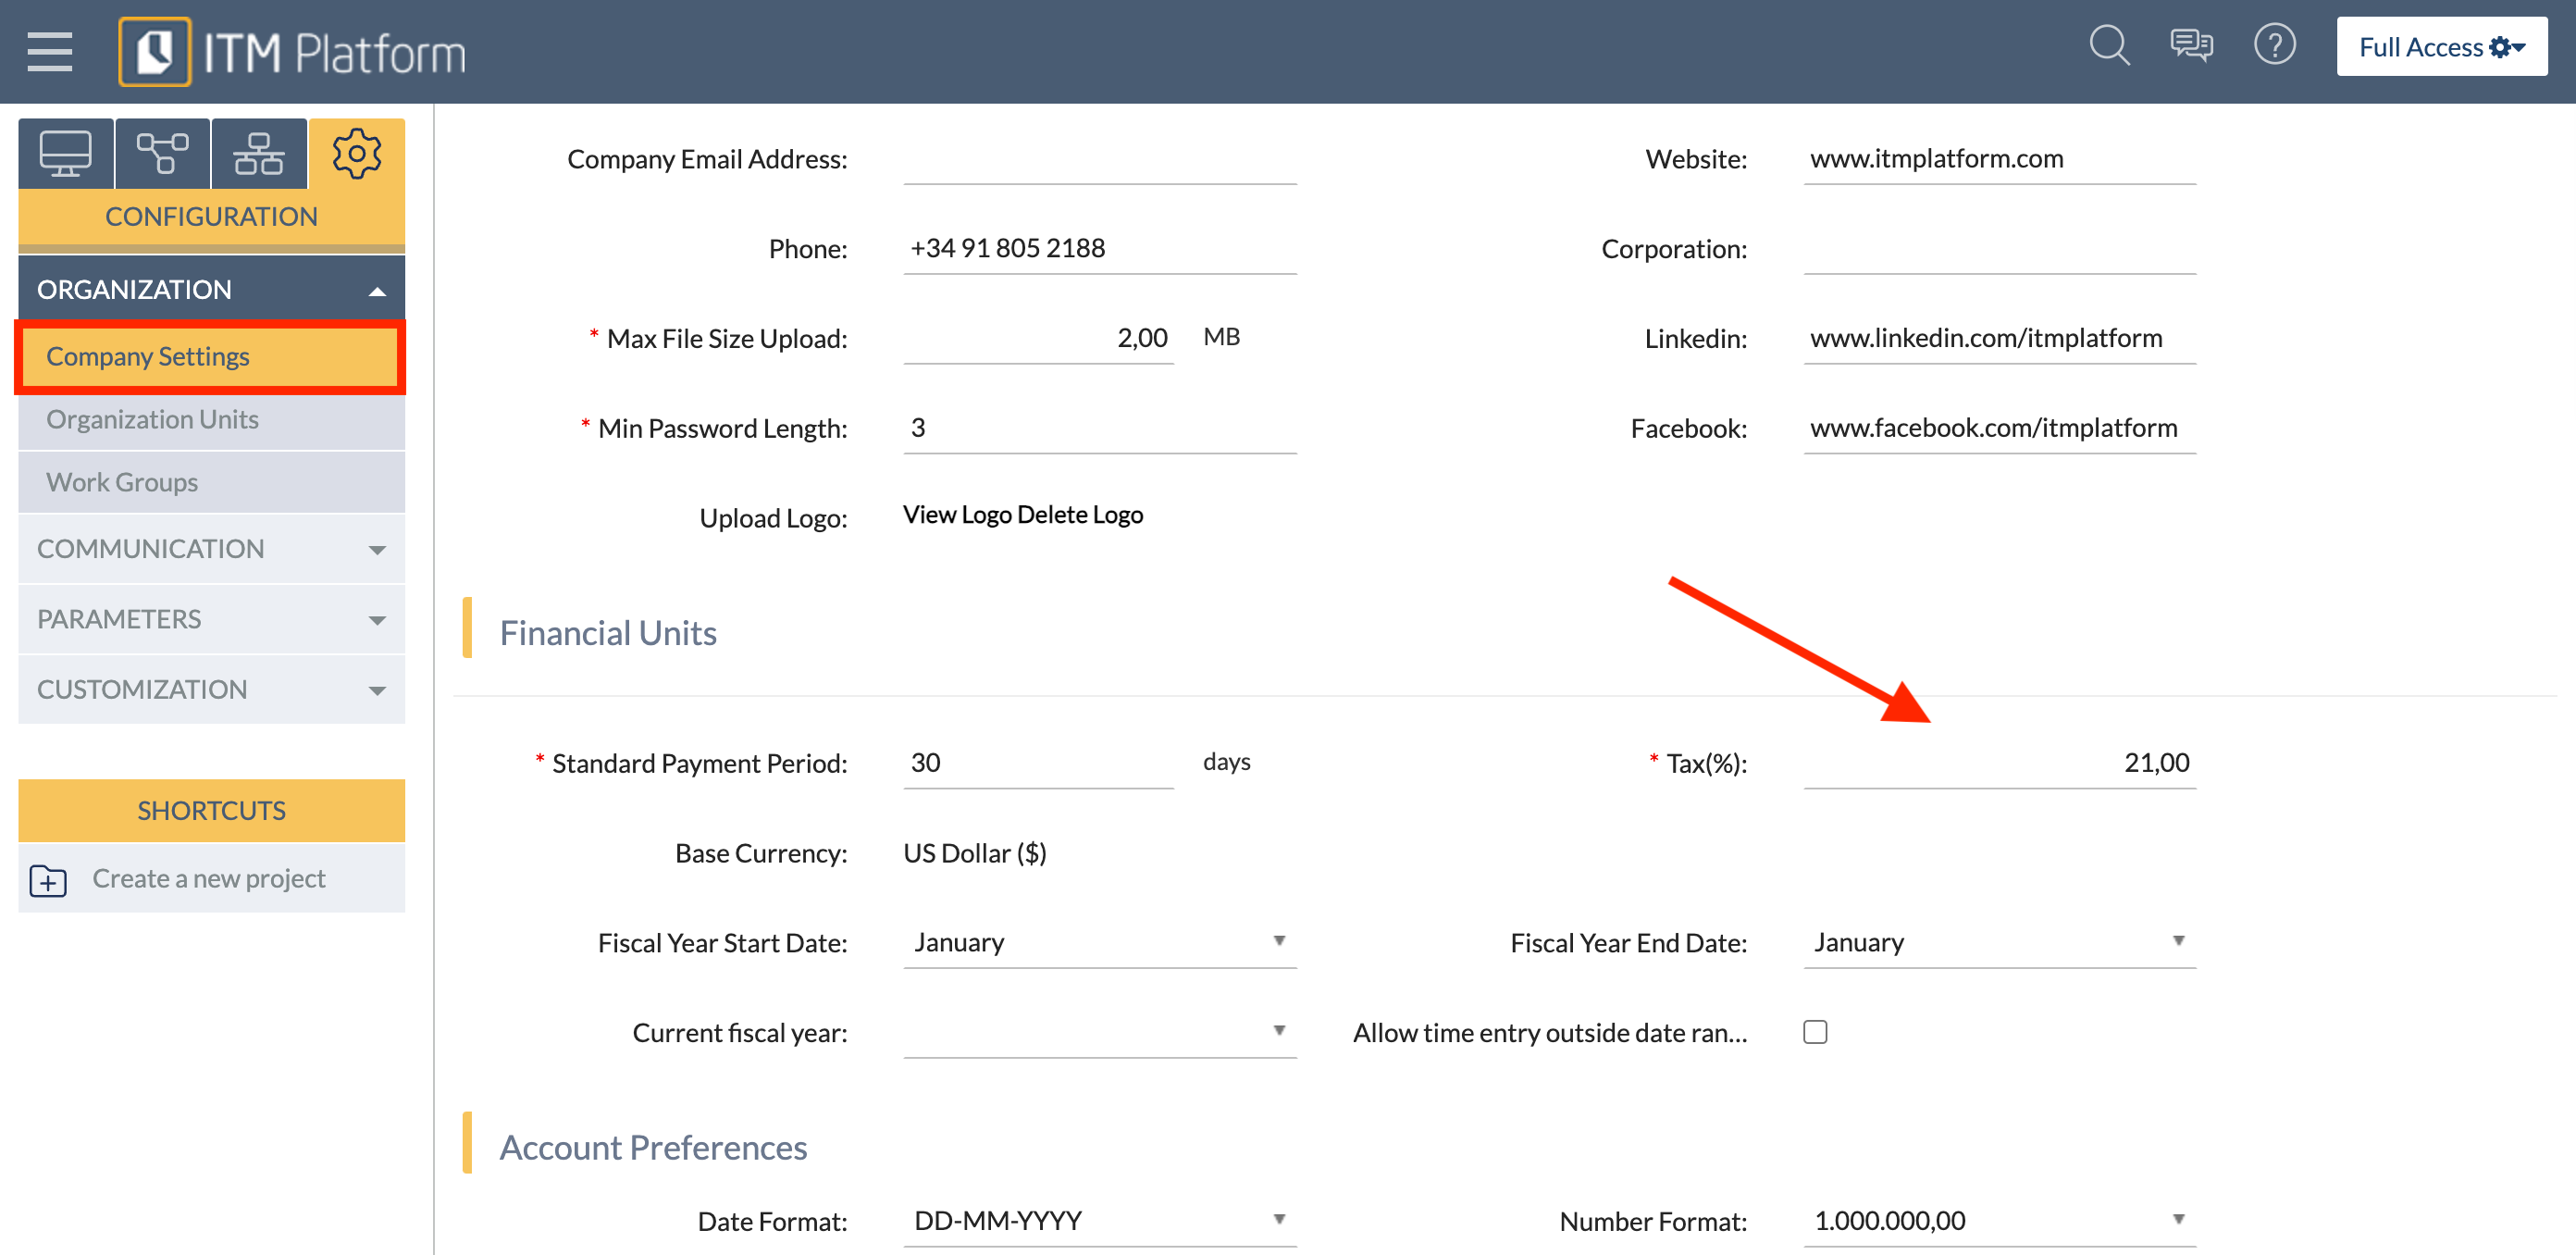
Parameters

The Project and Service Parameters sections allow administrators to define default methods for calculating hourly revenue. These settings are structured into two main areas:

  • Methods Tab: This tab provides options for setting company-level defaults, such as:
    • Actual Revenue Method: Set to “Hourly Based on Completed Tasks.”
    • Non-billable Hours: Enable globally to account for time that should not be billed.
    • Override Option: Allow project or service managers to override company-wide configurations by selecting “Allow project/service settings to override this configuration.”
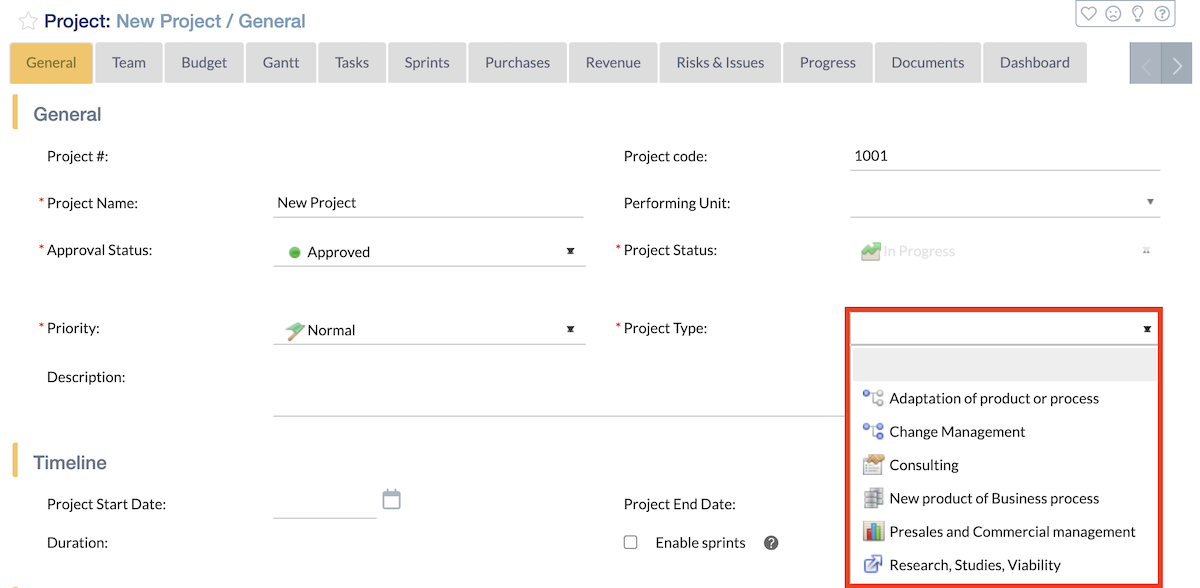
  • Project/Service Type: Different configurations can be applied depending on the type of project or service. For example:
    • Transformation Projects: May not require revenue tracking.
    • Consultancy Projects: Often require hourly billing.
    • Construction Projects: Might use task-based billing. Each project/service type can either inherit company-level methods or customize them to fit specific needs.

Resource Analysis

Resource Analysis

Resource Analysis is a feature within ITM Platform that enables resource managers to analyze users’ capacity, estimated, and actual efforts across projects and services. This tool provides insights into resource utilization, helping you identify discrepancies between planned and actual work, optimize project planning, and improve overall efficiency.

To access the Resource Analysis feature, Navigate to the MANAGEMENT menu and Select Resources.


The Request Section


The Resource Analysis interface begins with the Request section, where you configure your analysis parameters. This section comprises two main parts:

  • Mode Selection: Choose how you want to aggregate the data—either over time intervals or as total figures.
  • Filter Options: Specify which components (projects or services) you want to include in your analysis.

Once you’ve set your preferences, click Apply to generate a pivot table based on your criteria. Your configuration will be saved and automatically loaded the next time you access this section.


Mode Selection


The Mode determines how the data will be aggregated in your analysis. 

mode-selection

Intervals

Selecting Intervals generates a table aggregating hours over specific periods such as days, weeks, months, or quarters. This mode is ideal for analyzing efforts over time.

  • Period Settings:
    • Start Date: Define a starting point and specify the number of periods to analyze forward from that date. For example, analyze 4 weeks starting from September 1st.
    • Last: Analyze a set number of periods backward from the current date. For example, analyze the last two quarters.

Depending on your selection, additional fields will appear to accommodate your request.


Totals

Choosing Totals aggregates all efforts and hours without dividing them into periods. This mode offers two main options:

  • Live Between: Returns all components (projects or services) that were active at any point between the specified start and end dates.
    Example: If you set the dates from January 1st to December 31st, all projects active during that year will be included, even if they started before or ended after those dates.
  • Strictly Between: Returns components whose start and end dates fall entirely within the specified range. Example: To focus on projects that started and ended within the second quarter, select Strictly Between and set the dates from April 1st to June 30th.

Filter Options


The Filter section allows you to narrow down the components included in your analysis. You can filter by various criteria such as priority, client or duration.

filter

Generating the Pivot Table

After configuring your settings, click Apply. The system will generate a pivot table based on your selections, displaying the estimated and actual efforts for the chosen components and resources.

Your configuration is automatically saved and will be retrieved the next time you access this section, allowing for quick and consistent analysis.


The Pivot Table


The pivot table provides a flexible and detailed view of your data, enabling you to focus on the aspects most relevant to your needs.


Pivot Options


At the top of the pivot table, you have three options to organize your data:

  • work-item Component – Work Item: Displays projects or services at the first level, followed by tasks or activities, and then users. This view is useful for analyzing efforts at the task level within each project.
  • Component-userComponent – User: Shows projects or services first, users second, and work items third. This view helps you see how each user contributes to different tasks within a project.
  • user-componentUser – Component: Lists users at the first level, followed by projects or services. This view is ideal for analyzing each user’s involvement across various projects. In interval mode, this option will add the Capacity column for each interval, allowing you to compare it with the estimated and actual values.

Select the pivot option that best suits your analysis needs.

Viewing Estimated and Actual Hours


Depending on the Mode you selected, the pivot table will display different columns:


Intervals Mode

  • Period Columns: Each period (e.g., week, month) has its own column, showing the Estimated Hours and Actual Hours for that period.
  • Summary Column: An additional column provides a total of the estimated and actual hours across all periods for each row.

Intervals mode

Totals Mode

  • Total Hours Column: A single column shows the total Estimated Hours and Actual Hours for each row, giving you an overall view without time segmentation.

Totals mode

Customizing the Table

You can tailor the pivot table to focus on the most relevant information:

  • Toggle Rows: At the top of the table, you can deselect certain levels of detail. For example, if you don’t need to see individual tasks, you can unselect the Work Item row, resulting in a cleaner, high-level view.
  • Expand/Collapse: Use the expand and collapse icons next to each item to view or hide detailed information as needed.
  • Highlighting Values Based on Thresholds: Adjacent to the Filter Options, you can highlight values in your pivot table based on their relationship to other metrics, setting over and under threshold percentages to compare Actual values to Estimates and Estimates to Capacity (where available). Values that exceed or fall below these thresholds will be colorized in the pivot table, helping you quickly identify significant variances.
  •  

Examples of Resource Analysis Use


1. Comparing Estimated vs. Actual Efforts for Projects

Suppose you want to assess how accurately the estimated efforts align with the actual efforts across your projects.

  1. Mode: Select Totals.
  2. Totals Option: Choose Live Between and set the dates covering the fiscal year.
  3. Filter:
    • Priority: High
    • Client: Acme Corp
  4. Pivot: Select Component – Work Item to see the breakdown of tasks.
  5. Apply: Review the pivot table to compare the estimated and actual hours for each task within your high-priority projects for Acme Corp.

This analysis can help identify projects or tasks where the actual effort significantly deviated from estimates, providing insights for future planning.


2. Monitoring Efforts Over Time

To monitor how efforts are distributed over the next quarter:

  1. Mode: Select Intervals.
  2. Period Settings:
    • Start Date: Set to the first day of the next quarter.
    • Number of Periods: Choose 3 months.
  3. Filter:
    • Status: In-progress.
    • Is Service: false (only projects)
  4. Pivot: Select Component – User to see how users contribute to each project over time.
  5. Apply: Analyze the estimated and actual hours for each period, identifying trends or variances that may require attention.


3. Evaluating Individual User Contributions


If you want to evaluate how individual users’ actual efforts compare to estimates:

  1. Mode: Select Totals.
  2. Totals Option: Choose Live Between and set the relevant date range.
  3. Pivot: Select User – Component to focus on each user’s contributions across projects.
  4. Apply: Examine the total estimated and actual hours for each user, identifying discrepancies or outstanding performance.

Tips for Effective Resource Analysis


  • Regular Monitoring: Use Resource Analysis periodically to keep track of how actual efforts align with estimates, enabling timely adjustments.
  • Identify Patterns: Look for recurring discrepancies between estimated and actual efforts to improve future estimations.
  • Leverage Filters: Utilize the filter options to focus on specific clients, projects, or teams relevant to your analysis.
  • Simplify Data: Customize the pivot table by toggling rows and collapsing levels to make the data more digestible.
 

Resource Analysis in ITM Platform is a powerful tool for gaining detailed insights into your team’s estimated and actual efforts. Combined with the Capacity Planning features, custom dashboards, and optional integrations with third-party tools such as the Power BI templates, it provides a comprehensive solution for resource management. 

For further assistance or inquiries, please contact the support team.

Period End Close

Period End Close

The closing of a period allows the consolidation of actual values’ information between two dates.

Period closings will accumulate the costs and revenues corresponding to the reported efforts, paid purchases, and realized revenues within the selected period.

Costs and revenues are considered actual values in the following cases:

  • When efforts are reported or accepted by a user with an associated professional profile (defining their hourly cost), the cost proportional to the reported or accepted hours will be considered actual values.
  • When the status of a purchase/revenue is any of those defined as Actual Value (which can be customized in the purchases/revenues area of the ‘Parameters’ submenu within the ‘Configuration’ menu), the value defined as actual will be considered as such in the project budget.

Cash or treasury movements typically occur on specific dates, such as the end of the month. To monitor these transactions, performing Period Closings is advisable.


Once the period is closed, hours can no longer be reported within it, and the budgets of the affected projects will show the consolidated values up to the last closing.

Period closings will generate closing documents that represent the worked hours and their cost/rate for each provider, plus an additional one for the internal team.


During the closing process, you can choose the providers and individuals who will be affected. If you want to close for both external personnel (providers) and internal personnel (employees), choose “all.”

In the closing document, you can choose to make adjustments, which can be useful to inform providers about what they should invoice, in case they invoice by the hour.

You may also be interested in reading Professional Profiles and Standard Costs.

Webinar: Financial Management

ITM Platform PPM Product Demonstration

ITM Platform PPM Product Demonstration

Main features of ITM Platform, the PPM software that aligns your project portfolio with the business strategy.

Your team will learn how to manage all the management tools of their work in one day, offering portfolio managers the metrics that really matter.

Configuration, training, and deployment are done in less than two weeks.

ITM Platform Configuration

ITM Platform Configuration

Course Content:

  • Organization data
  • Communication settings
  • Organizational units
  • Profiles and rates
  • Role definition
  • Calendar – working days and hours
  • Main entity parameters (projects, services, purchases…)