Tracking projects based on Agile Methodology

Tracking projects based on Agile Methodology

Index

The following article explains tracking progress in projects managed with Agile methodology.

Unlike tracking the progress in waterfall projects (Gantt), projects based on Agile methodology don’t have a required calendar projection, therefore the way to track progress differs from Waterfall.

In the “Progress” section of an Agile methodology project, you will find the following sections: Progress Report, Tasks by Type, and Charts / Diagrams.

Progress Report

The manual progress report makes it possible for the project manager to create a record that indicates the progress observed (% completed), as well as the evaluation (list of configurable values), a description, and a date.

This is useful when the progress of the project is not only represented by the consumption of tasks, but by the achievement of the deliverables of the project.

Task progress report by changing the task column

When you move a task to a completed column, you can configure the system so that its progress is increased to 100%, generating automatic progress report.

To configure this behavior in agile projects, access “Edit board layout”, edit the column of the type “Completed” that you want and tick the checkbox “Automatically update to 100%”

Thereafter, the tasks you mark as completed will be assigned 100% progress.

Note that if you roll back the status to a “Pending” or “In Progress” type, you will need to manually assign the new progress, if desired.

Tasks by type

This chart represents the percentage of tasks in each status present in the project at this time.

The standard status types are “To Do”, “In Progress” and “Completed.” It is independent of the number of columns that the Agile board has because each column will be based on one of these three types.

Tasks per status can be seen in either the group or swimlane view.
You can also eliminate one of the statuses and in turn the chart will be recalculated based on 100 and display the remaining statuses.
In this example, we have removed the “Completed” status and now you see the composition of the backlog (Pending and In Progress).


Tracking Charts/Diagrams

This section provides two options: Burndown chart and Cumulative Flow diagram (CFD).

Both share the same filtering block which allows you to customize the displayed information according to your preferences.

Date Interval (start and end)

Determine the timeline the chart will represent.

It is important to note that the dates that are reflected in the charts are those of the task status changes. That is, they are not the start or end dates of tasks.

You can view all date and status changes in the “Event Log” section of the task.

Default settings

  • The Cumulative Flow diagram will start on the creation date of the first task and end today.
  • In the Burndown chart, the chart corresponds to the start and end dates of the project.

Dates representing verticals (X-axis) are the result of dividing the period by 14, so that regardless of the temporal dimension of the chart, you will always have a homogeneous view. If the duration is less than 14 days, you will notice as many intervals as there are days.

Columns and swimlanes

You can choose to show or hide tasks that belong to:

  • Columns: Remember that each column has one of three types and these are the ones that are represented in the charts.
  • Swimlanes: either used as process types or sprints.

Burndown Chart

Represents the dynamics of tasks completed.

The Burndown chart is generally used when all tasks are determined from the beginning.
Let’s look at an example:

Notice that the backlog shows tasks that are created on the same day. Let’s see what happens if we move one to “Completed” status and another to “In Progress”.
If we follow the completion rate of tasks, we will eventually leave the work column pending to zero.
However, if we add “To Do” tasks as the project or sprint continues, we will notice anomalies in the trend because instead of reducing the backlog, it will increase.
Expected line of progress

This is a straight line that connects the number of tasks in the “To Do” status on the Y-axis to the beginning of the interval on the X-axis at that point in time. At that point in time, there should be no pending (Y-axis =0), so it is steadily declining.

How to interpret: If the tasks are of similar size, the number of pending tasks should be represented by the expected progress line.

Actual line of progress

Represents the actual number of pending tasks on interval. That is, the overall pending tasks at the start minus those completed. We’ve explained this concept prior with bar chart example.

The slope of the progress line indicates the “velocity” and determines the number of tasks completed per time block (usually a sprint).

How to interpret a Burndown chart

On-track: The expected and actual line of progress are together. If it keeps this pace, the project will end in time.

Behind schedule: If the actual progress line is above the expected line, it means that the team is delayed and should have completed more work at this point.

Ahead of schedule: If the actual line of progress is below expected, it is progressing at a faster pace than expected. You can finish earlier than expected or add tasks. These interpretations are valid as long as the tasks are the same size, i.e. the time to solve them is similar.

Burndown Diagram Limitations

The Burndown diagram only represents the completed work. It reports the pending work, but it doesn’t reflect what is in progress.

Burndown works best on sprints or short projects and makes less sense with long-term projects. In long-term projects, pending work goes through many changes in order for the estimates to make any sense. This is the biggest reason why Burndown is not recommended for Agile methodology.

The Burndown diagram represents scope changes, as changes in the backlog are not displayed effectively.
These limitations are overcome by the Cumulative Flow Diagram.

Cumulative Flow Diagram (CFD)

A Cumulative Flow diagram is a stacked area chart that shows, in each time interval, the number of tasks per status.

Reading the CFD

As you go along, the diagram shows the task flow by status. It is called “cumulative “because it does not measure increments between intervals but counts each element in each status, regardless of whether it was in that same status previously.

This way, it solves the main Burndown problem, as it represents situations in which to-dos are not all created on the first day.

The CFD provides two fundamental pieces of information in Agile management: Work in Progress (WIP) and Cycle Time (CT).

The “In Progress” bandwidth represents work in progress (WIP).

The space between time intervals provides Cycle Time (CT) represents the average time it takes a task to move from one status to another.

Limitations of the Accumulated Flow diagram

Despite solving the main limitations of the Burndown chart, the CFD has its own limitations.

• It does not reflect whether any task is blocked
• Related to the previous one, it does not indicate the individual cycle time, which means the amount of time that a particular task has remained in a single stage.

These limitations can be resolved through reports or custom views of tasks.

Expected progress of summary tasks and projects

Expected progress of summary tasks and projects

The expected progress calculation is made assuming that, up until present time, all tasks are completed in the same percentage as time has elapsed since its inception. On that basis, the expected percentage will calculate the progress of summary tasks and projects in the same way that it is done with the calculated progress.

For example, if a task lasts 10 days and today’s date is on the seventh day, the system will take a 60% expected progress for that task (6 days elapsed/10 days total).

Once all tasks have been calculated, the expected percentage for summary tasks and for projects will accumulate, resulting in the expected % of both.

ITM Platform will take into account the default calendar and weekends for calculating expected progress, just as they are used in the calculation of tasks duration.


Expected progress of the baseline

If you have an active baseline, the expected progress will be calculated for both the ongoing planning and baseline, counterposing both the project tracking curve.


How reliable is the expected progress?

The calculation is a temporary projection and therefore does not necessarily represent the expected real progress of the project, unless the actual progress of the tasks is proportional to the time.

In other words, real productivity is not necessarily linked to the elapsed time. The project or task manager reports on the actual progress and not on the progress of time. This may be reason why the expected % may differ from what has been done.

Example: You have a task to lay bricks for 10 days, however, more bricks are stacked in the first couple days than the last. The Task Manager is aware of this and at the end of the third day reports a progress of 40% (there are 40% of the bricks). However, the expected progress will not reflect reality, because the calculation is 30% (3 days elapsed/10 days total)


Tracking progress of tasks and Waterfall projects (Gantt)

Tracking progress of tasks and Waterfall projects (Gantt)

ITM Platform gives you the tools to report and monitor the progress of tasks in a project. Task progress will be used to compute the calculated progress of summary tasks and the project’s total progress.

Before continuing, let’s define two similar but not equal concepts:

  • Progress of a task, a summary, or a project (also referred to as percentage completed) is a percentage that represents the actual progress ratio. Thus, 0% will indicate that it has not been started, and, in general, 100% indicates it has been completed. You can mark tasks and projects as completed without reaching 100%.
  • Progress report of tasks and projects offers additional information. It includes an assessment (configurable values list), a description, the percentage completed (progress), and a progress report date.

The progress value represents its real progress and is generally reported by the task manager or the project manager.

The progress of the task is not caclulated by the actual consumption of estimated hours. The hours invested in the task do not necessarily represent the actual progress of the task.

Who can report the progress of a task?

Usually, it is the task manager or the project manager, although users with Full Access permission can make changes without necessarily having to be assigned to the project.

Where can you report progress on tasks?

There are three places from which a user can report progress: Timesheet, Task Tracking section, and the Gantt.

It is possible to track in an automated way from another application using the API.

Tracking from the timesheet

Task managers will see a “progress” icon on the timesheet that will allow them to create a progress report.

Tracking from the “Task” tab

The tasks have several sections of information, one of them being “Progress”, where you will see a tracking history as well as the possibility of adding a new one.

Progress report by changing the task status

When you move a task to a completed type of status, you can configure the system so that progress is increased to 100%, generating automatic progress report.

To configure this behavior in waterfall projects (Gantt), access the SETTINGS menu > PARAMETERS > Task Parameters > Task Status. When selecting “Status Type”, tick the “Automatically update to 100%” check box

Thereafter, the tasks you mark as completed will be assigned 100% progress.

Note that if you roll back the status to a “Pending” or “In Progress” type, you will need to manually assign the new progress, if desired.

Progress Report from the Gantt chart

In the Gantt chart, there is a “% Completed” column that can be edited by the project manager.

When saving, a progress report will automatically be generated for each task. Progress of summary tasks will be updated following the calculated progress method configured in the project. If the option is checked, a project progress report will also be created.

Progress Report section

In the Progress section of the project, you will have access to the following metrics:

  • % Completed: represents the progress created by the project manager, either manually or automatically.
  • % Expected today: represents the progress that the project should have reached today, based on its duration.
  • Baseline – % expected: represents the progress you would expect from the active baseline.
If you did not set a baseline, this data will not be reflected in any of the charts.

In this section you will also find:

  •  “Add a progress report” button, the option to report progress manually
  • “View History” button, that allows you to access previous progress reports
  • “Description of current status” section shows last report description
  • The “Earned Value” button will show you the project’s Earned value analysis


Other related articles in the Project and Task tracking section.

Project baselines

Project baselines

Baselines allow you to set control points in planning, which may be compared to the current situation of the project.

ITM Platform allows you to establish as many baselines as you want, being able to have one of them active (active baseline), which will be the one that compares with the current situation.

When you set a baseline, different types of project information are saved: schedule, effort in hours, costs, and revenue.

  • Schedule
    • Start and end dates of the project.
    • Start and end dates of all tasks.
  • Hours:
    • Budgeted hours (for internal, external, and undefined teams).
    • Estimated hours.
  • Costs:
    • Budgeted and estimated cost of hours.
    • Projected amounts of purchases and their dates.
    • Amounts of budget accounts.
  • Income: expected amounts and their dates

Set a new baseline

New baselines can be created from the General, Budget, and Gantt sections (in case of waterfall projects). From any of these locations, the baseline will record the full project information.

In order to establish new baselines, you need to have the necessary permissions assigned to your user role.

  • From the General section, click on the “Manage Baselines” button and click on the “Create new baseline” button.
  • From the Budget section, click on the button “Create new baseline.”
  • From the Gantt, click on the button “Create new baseline.”

In all cases you will be asked for the name of the baseline, proposing by default one sequential to the previous—if one already existed—and offering the possibility to establish it as an active baseline.

Set an active baseline

You can set an existing baseline as active from the General section of the project, clicking on the “Manage Baselines” button. Select the existing baseline and click the option-button on the left, or click on the option-gear on the right and select “Mark as active.”

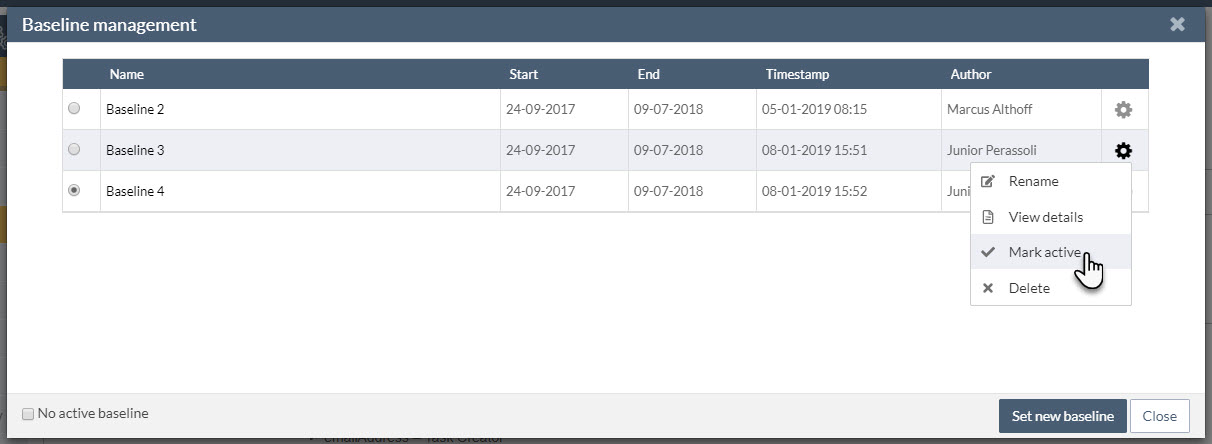
You can also uncheck the active baseline and leave the project without any.

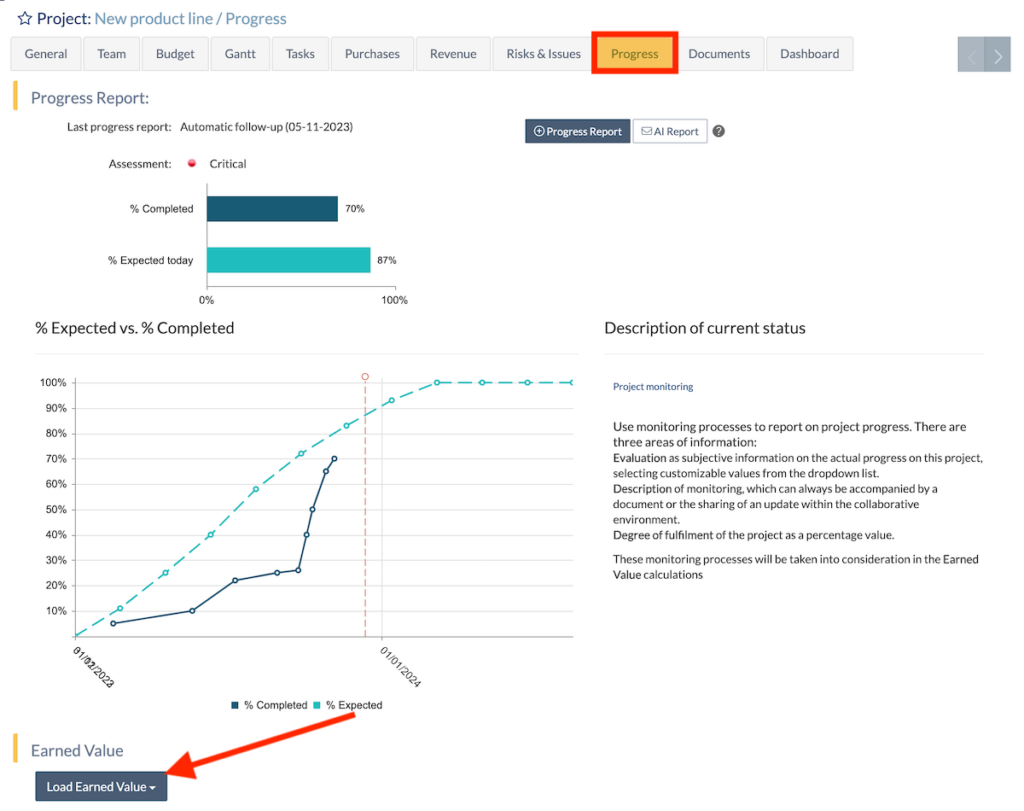
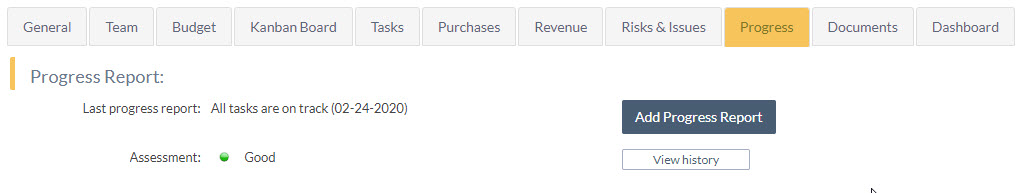
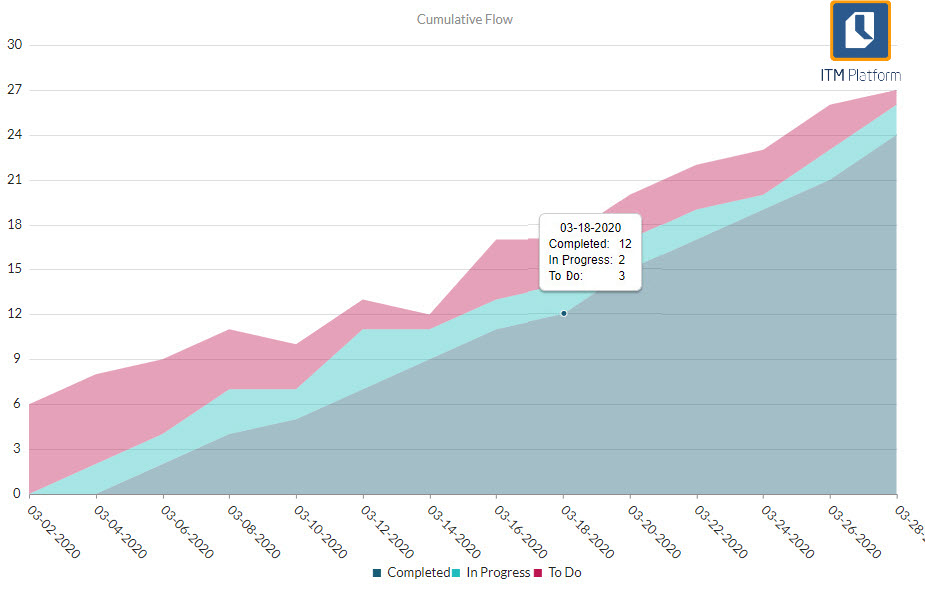
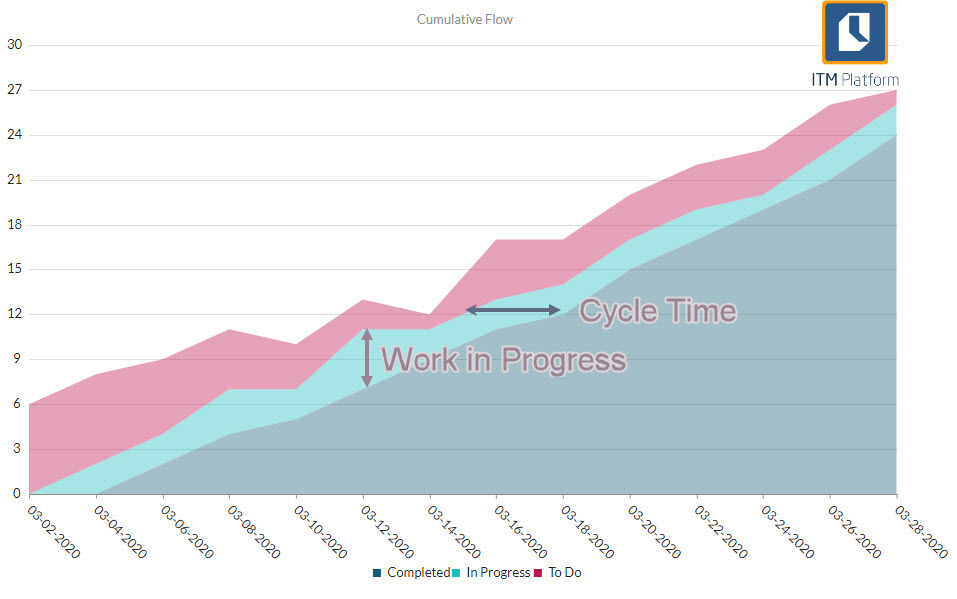
Access baseline data

Baseline information is accessible in the same places where the current situation of the project is located, so that it can easily be compared.

  • General section of the project
  • Budget
  • Gantt
  • Project lists and task lists
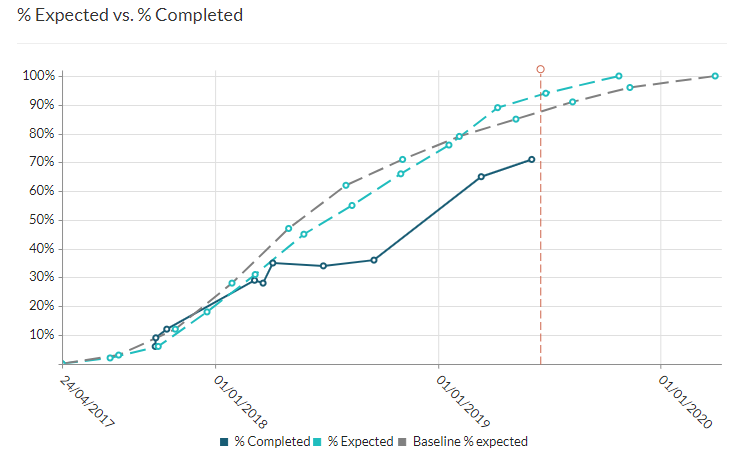
  • Reports
  • API

The names of the baseline fields are identifiable by their homonyms of the current situation, because they add to the same name the word “baseline.”

Calculated progress

The Calculated Progress

This section applies to waterfall projects. Agile progress tracking is explained in Tracking projects based on Agile Methodology

The calculated progress applies both to summary tasks and the whole project.

The calculated progress is determined by its tasks’ progress and a measure of weight for those tasks: duration or effort.

In the example, the summary task (1) has a calculated progress of 14% based on the progress of its tasks. Similarly, the project calculated progress (2) is 13% based on the progress of all tasks.

Task weighting

Progress calculations are made based on each task’s progress and on a measure of weight that will determine how important each task is in relation to the others. Having completed a very relevant task is not the same as having done so on one that has little impact on the summary task or the project.

The two units used to weight tasks are their duration and the number of estimated hours. Every project will use one of these methods, so calculations within the project will be consistent.

How to set the progress calculation method

The progress calculation method can be set in the project’s General section, under the section “Methods.” You will be able to choose between the two available methods. Please notice that if you change the method, the progress of all summary tasks will be recalculated, as well as the project’s calculated progress. The project’s % Competed will remain unchanged until you decide to do so.

This setting can also be set for all projects or just those of a particular type.
To do so, go to CONFIGURATION→PARAMETERS→Project Parameters→Methods, and select the method of your choosing as well as whether you want to allow the project settings to override the company’s preference. You also can set the progress calculation method per project type on CONFIGURATION→PARAMETERS→Project Parameters→Project Type

Duration-based weighting

This is the default method used to calculate the progress of summary tasks and the whole project.

It assumes that a task having a longer duration has a higher weight on the overall progress calculation. Let’s see the formula used to calculate the progress in a project or summary task with “n” tasks:

Calculated progress = % t1 * d1/D + % t2 * d2/D + % t3 * d3/D + … + % tn + dn/D

Variables used:

  • %tx : the completed percentage of the « x » task
  • dx: the duration in days of the “x” task
  • D: the sum of all task durations of the project or summary task

Let’s see this formula in action with an example. In the following 20-day project, there are three tasks:

  • Task 1: 9-day duration, with a 35% of completion
  • Task 2: 7-day duration, with a 22% of completion
  • Task 3: 4-day duration, with a 0% of completion
  • Total Duration: 9+7+4= 20 days

Replacing the variables with values in the formula:

Calculated progress = 35%*9 days/20 days + 22%*7 days/20 days + 0%*4 days/20 days= 23%

Effort-based weighting

This method uses the estimated hours per task to weigh the progress of each one of them. As a result, tasks having more estimated hours will weigh more than those having fewer hours.

Calculated progress = % t1 * h1/H + % t2 * h2/H + % t3 * h3/H + … + % tn + hn/H

Variables used:

  • %tx: the completed percentage of the « x » task
  • hx: the estimated hours for the “x” task
  • H: the total estimated hours of the project or summary task

The estimated effort will be the sum of all estimated efforts for each team member assigned to the task plus the unassigned estimated effort if any.

This method is useful when the task duration doesn’t represent the total effort involved in carrying out the task. For example, when some tasks have more team members than others.

When does progress get calculated?

Whenever you update a task’s progress, summary tasks and the project will have their calculated progress automatically updated. You can update the task’s progress from the task file (Progress section), form the Gantt, the API, or any connector, such as Teambot for Slack or the Jira Connector

If, in addition to getting the calculated progress, you also want to create an automatic progress report, you can:

  • In the Gantt section, next to the “Save” option, tick the “Create an automatic progress report.”
  • In the task’s Progress section, tick the “Create an automatic progress report.”