AI-Generated Reports Feature

AI-Generated Reports Feature

Introduction

In project management, clear and effective communication is essential, particularly when working with diverse teams and complex projects. Traditional tools like dashboards are valuable, but they can sometimes present challenges in interpretation for all stakeholders.

To support clarity, ITM Platform offers an AI-Generated Reports Feature. This uses the capabilities of Generative AI to transform complex project data into clear, concise reports. It is designed to be accessible to stakeholders of all levels, regardless of their familiarity with project management terminology or data analysis.

The AI-Generated Reports Feature operates by analyzing and summarizing the extensive data generated in project management activities. It processes various data types, including financial information, time estimates, risk assessments, and more, converting them into an easily digestible format. 

AI Reporting ITM Platform

How to Use the AI Reporting Feature

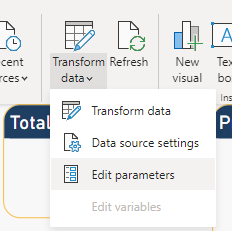
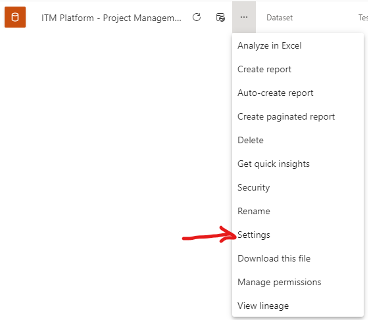
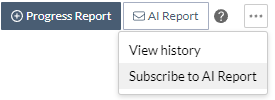
  • Navigate to the “Progress” tab in your project. Here, you’ll find a button labeled “AI Report.”

IA reports button

  • Click on the “AI Report” button. The report will be processed and sent to your email within a few minutes.
  • The “AI Report” button will remain disabled for the specific project until the report is delivered to your email.
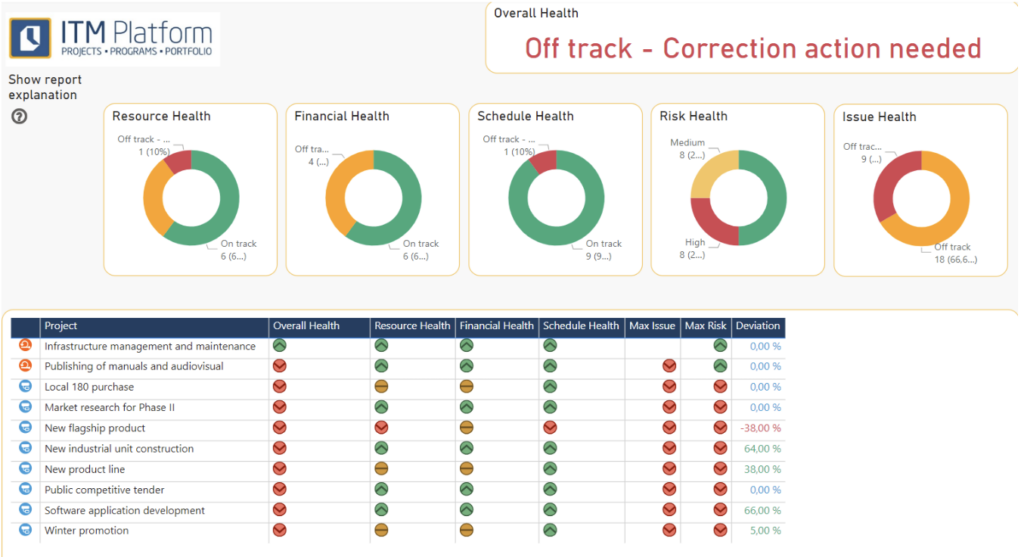
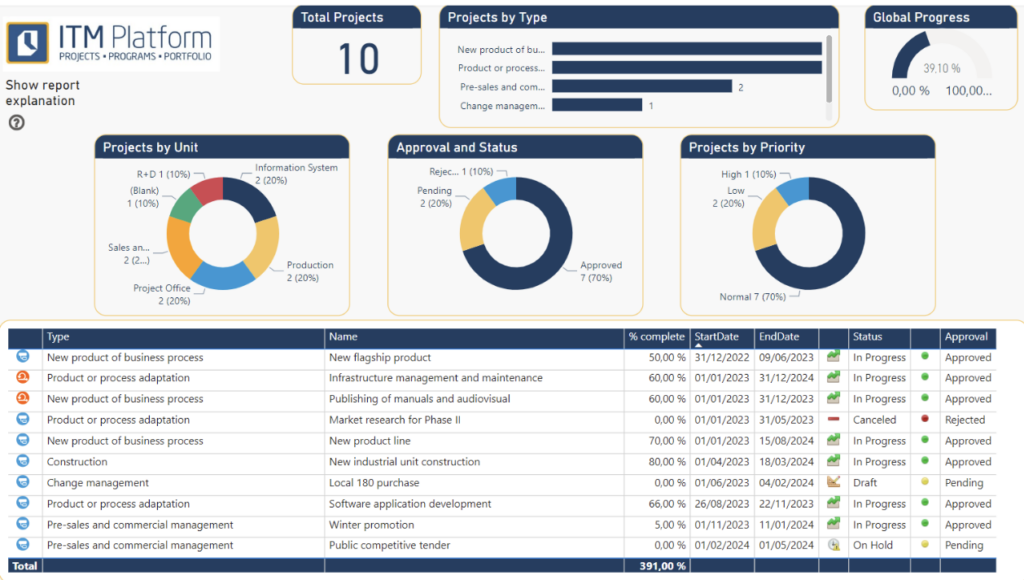
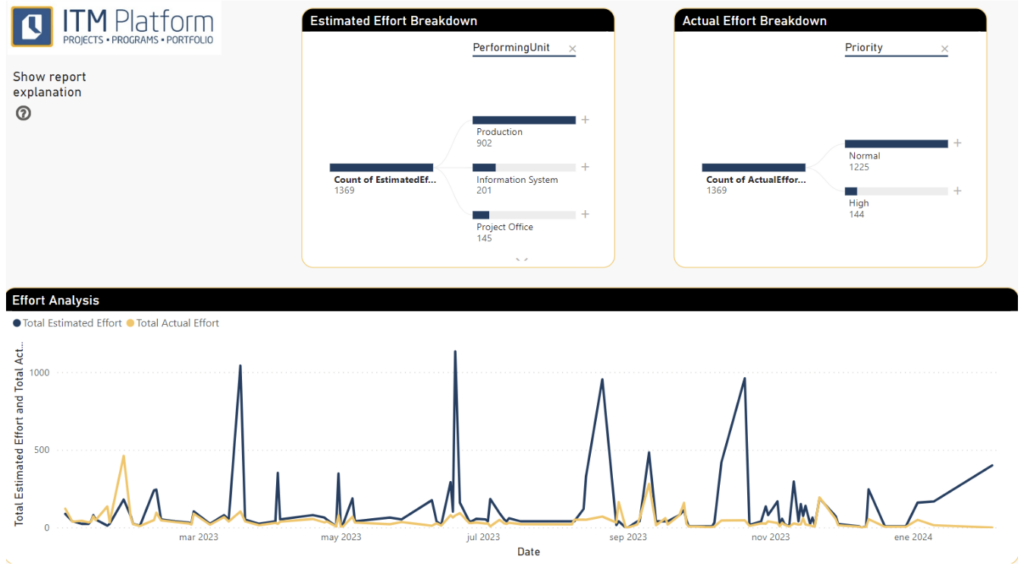
  • Interpreting the Report. Please note that, as an AI-generated report, it may contain inaccuracies. It provides an overview and is not intended as a detailed analysis tool. For a comprehensive analysis, refer to our dashboards (How to Use Customizable Dashboards).

Weekly Subscription to Reports

From the same section, choose “Subscribe to the AI report”. You will receive an immediate report, and then one each week with any updates that have occurred.

IA reports subscription

The administrator can select the project statuses that can be subscribed to from the ‘Parameters > Projects > Project Statuses’ section.

Who are subscriptions useful for?

  • Project Managers, to have up-to-date information
  • Managers and stakeholders who connect to ITM Platform less frequently but want to stay informed about the progress of the most relevant projects.


How It Works in the Background

The AI reporting feature operates by:

  1. Data Collection: Gathering raw data from your project in a machine-readable format.
  2. Data Processing: Different project management methodologies yield various data types. For instance, Waterfall projects calculate Earned Value metrics, while Agile projects focus on task flow. Common data elements like financials, risks, issues, and time reports are also included.
  3. AI Processing: This raw data undergoes preprocessing and is fed into an AI model. The AI then generates a human-readable report directly sent to your email.

Security and Data Handling

  • Third-Party AI Systems: We utilize advanced AI systems like Azure AI and OpenAI for processing.
  • Data Anonymity: No company-identifiable data or project names are shared.
  • Preprocessing of Data: Data is preprocessed to minimize the risk of identification. However, please be aware that some data may potentially lead to identifying your company or project.
  • Encryption and Privacy: All communications are encrypted. There is no data retention in third-party services, nor is your data used to train other models.

The AI Reporting Feature on ITM Platform simplifies the interpretation of complex data, ensuring project insights are easily accessible to stakeholders at all levels.

Power BI Templates for ITM Platform

Power BI Templates for ITM Platform

Power BI Templates for ITM Platform are for users who want to create dashboards and visualize their organization’s data.

Designed specifically for ITM Platform, these templates provide charts and analysis based on best project management practices. They also offer the possibility of integration with other applications, such as your ERP or CRM.

You can use the templates as a blueprint to create customized reports and dashboards to monitor the performance of your projects, identify issues and make informed decisions in real time.

What you need:

  • A template
  • Power BI Desktop to customize the template (free)
  • A Power BI Service license, if you want to publish it on the internet (optional)

With Power BI Service, you can publish reports in a private environment that only users in your organization can access (verify pricing). Alternatively, you can use Power BI Desktop to create reports and visualizations without publishing them online.

Once you have downloaded the template and setup Power BI Desktop, you can:

  • Connect the template to the ITM Platform
  • Publish dashboards on the Power BI Service

To create dashboards tailored to your organization, open the template in Power BI Desktop and make the desired changes. You can customize the charts, tables, key figures, and visualizations to suit your needs.

If you need help, you can find the documentation online or request support from ITM Platform or a specialized consultant.

How Power BI Works with ITM Platform

Available templates

Health Indicators

Plantilla Power BI indicadores de salud Displays the health of the projects and portfolio with standardized health calculations.

Summary of projects with status

Plantilla Resumen de proyectos con estado List of projects with basic information, including the possibility of obtaining a detailed view of the projects in both waterfall and agile versions.
Financial Analysis Plantilla Análisis financiero

View of budget performance and financial analysis by dimension.

Summary of finance and scheduling


Plantilla Resumen de finanzas y programación In addition to the above view, it includes a view of project scheduling and progress.
Effort Analysis Plantilla Análisis de Esfuerzo View of effort behavior and analysis of such effort by dimensions.

Full Template

  It includes all of the above views integrated into a single report, ideal for the PMO or an executive.

Connecting the template to ITM Platform

Essentially, you need to edit the instance parameters and API key, click “Update”, and check that the information has loaded correctly.

  • Download the PBIX sample and open it in Power BI Desktop.
  • Click on Transform Data → Edit Parameters

  • Fill in the values for the Instance (environment) and API Key, and click OK. The ProjectId and TaskId parameters are only required to make changes to the queries.
    • To find the Instance, look for the first part of the URL of your ITM Platform account. For example, if your ITM Platform URL is https://app.itmplatform.com/mycompany/UserPages/Home.aspx, the instance would be “mycompany” (without  quotes)
    • To generate the API Key, go to the “My Profile” section of your ITM Platform account and select the “API Key” tab.
      • Click the “Generate” button to create a new API Key.
      • Once the API Key is generated, copy it and store it in a safe place. Note that only the last four characters of the key will be displayed, so make sure to copy the entire key.
      • Paste the API Key into the “API Key” parameter.
  • If a login dialogue is displayed, the Anonymous access option must be selected.
  • Click on “Update” and wait for the update process to finish. It may take several minutes, depending on the amount of information in your environment.

  • Verify that the information has been uploaded to the report:

Publish dashboards in the Power BI Service

To access and keep up-to-date the online reports of the Power BI service, you need to publish the PBIX files in the Power BI web application, set up credentials and schedule the automatic update of the record.

Proceed as follows:

  • Ensure that the local Power BI file is connected and updated according to the procedure described above.
  • Publish the PBIX in the Power BI web application by clicking the Publish button in Power BI Desktop.
  • Choose the place of publication. It is recommended to use a custom workspace, not “My Space”.
  • Wait for the publication process to complete:
  • Navigate to the workspace to identify the dataset:
  • Click on … to display the dataset menu and click on Configuration:
  • Locate the Credentials section of the data source and click on “Edit credentials”.

  • Set or check that the authentication method is Anonymous, and the privacy level is Organizational. Do not activate the option to skip the connection test.
  • Click Log In to check if the data source is accessible:

  • Expand the Auto-Update section and set the desired schedule:

  • Click on the link above to display the dataset:

  • Click on Refresh and wait for the dataset to be updated:

  • Check that the report displays correctly:


The Power BI templates for ITM Platform are tools for creating dashboards and visualizing project data. They provide charts and analysis based on best project management practices and the ability to integrate with other applications.

  • To customize templates and create custom dashboards, open the template in Power BI Desktop and make changes to charts, tables and visualizations.
  • To access reports online and keep them up to date, publish PBIX files in the Power BI web application and configure the credentials and schedule to update records automatically. Power BI Desktop can be used to create reports and visualizations without publishing them online.

When to use ITM Platform Custom Dashboards or the connection to Power BI?

ITM Platform’s customizable dashboards provide analytics that enable users to visualize and monitor the performance of their projects in real-time. However, these features may be more limited than those offered by Power BI.

Therefore, if you require more comprehensive data integration from third-party applications or advanced data analysis and visualization features, we recommend using Power BI.

The choice between ITM Platform and Power BI dashboards depends on the specific data analysis and visualization needs of the organization.

.

How to Use Customizable Dashboards in ITM Platform

How to Use Customizable Dashboards in ITM Platform

ITM Platform’s custom dashboards allow you to access built-in dashboards, create your own, or modify existing dashboards to suit your needs. 

These dashboards are made up of charts representing helpful information about any entity or entities in ITM platform, such as projects, tasks, risks, issues, revenue, or purchases. 

To access the dashboard list, go to the management menu and click on “Dashboards”

If your organization has not yet created custom dashboards, you will have access to the pre-configured ones, which you can duplicate and edit

Editing or creating a dashboard

When editing an existing dashboard or creating a new one, you will find a three-dot menu in the top right corner.

This menu will give you access to add new charts, change the layout, or change the permissions for other users.

Adding a new chart

To add a new chart, you can choose a chart type, such as column, bar, line, area, or pie, and select a table, such as “projects.” Then, choose a category, such as “business goal,” and add a secondary table if needed. Next, select a value, such as “total actual cost,” and choose an operation to perform on that value, such as count, sum, average, maximum, minimum, or the first value.

Once you select the operation, a chart preview will appear, and the chart title will be automatically generated as a suggestion. You can change the chart title at any time at your convenience. When you’re done, click on save, and your new chart will load in the dashboard, showing the actual values.

All charts in one dashboard will share the same data set, allowing you to set a global filter for your dashboard.

Filtering

To edit filters, click on the edit filter button on top of the dashboards. When you click on it, you can add filters that will affect all your charts. If you require charts with different filtering, create a separate dashboard.

When editing the filter, select a table present in the data set, such as “projects,” and then select by which field you want to filter, such as “duration.” Depending on the field you have chosen, you will have an operator that you can choose from, such as equals, doesn’t equal, includes, doesn’t include, less than, less or equal, greater than, or greater or equal. You can add as many filter lines as you need to tailor your dashboard to your specific needs.

⚠️ Keep in mind that ITM Platform dashboards are fetching your data in real-time, and some of these fields are calculated. Depending on the complexity and volume of your data, plotting your dashboard may take a while. Therefore, be careful when you select calculated fields, such as estimated costs and expected deviations.

Changing Dashboard Layout:

To customize the overall dashboard design, click on “Layout” from the main menu. There are two main options:

  • Charts per row: You can choose a fixed number of charts per row or a flexible number of charts per row. When you select a fixed number of charts per row, the chart size will adapt to fit the number of charts you have chosen into a row. If you select the chart width, the number of charts per row will change depending on the window size. If you’re unsure about which option to choose, we recommend the default one, which is a fixed width per chart with a flexible number of charts per row.
  • Height/width ratio: You can change the height/width ratio to create different shapes of charts within your dashboard.

Permissions

To access the permissions editor, click on the three-dot menu, then “Permissions.” There, you will see a list of users and roles with access. If you created the dashboard, you will find yourself as an editor.

To grant access to other users or roles, simply deploy the drop-down menu and select the particular users or roles you want to give access to. Once you have selected the user or role, choose whether to make them an editor or viewer. Then, click on “add,” and they will be added to the list of users or roles with granted permissions.

Embedding Dashboards

Once you have defined a dashboard in ITM Platform, you can embed it in your own web pages, such as the intranet of your organization. This mode will not require users to log in to ITM Platform since the dashboard credentials will be embedded in the web page.

⚠️ This feature is currently being deployed among users having access to the dashboards.

ITM Platform’s custom dashboards offer a range of features to help you access and visualize your data. From editing and customizing your charts to filtering and changing the layout, you can tailor your dashboard to your specific needs. With the ability to grant permissions and embed dashboards, ITM Platform makes it easy to share your data with others in your organization.

Creation and management of reports

Creation and management of reports

ITM Platform allows you to create customized reports that will be very useful when tracking and controlling the data that is required in real time. All ITM Platform reports are exportable to Excel. In addition, you will be able to create reports and charts with the ITM Platform data in Excel through an integration of both systems using Power Query, as you can see in this article.

Three types of reports can be generated: Three types of reports can be generated:

Lists reports

Lists reports can be created from several ITM Platform sections depending on which information you want to analyze. In a large number of sections of ITM Platform you can define and view a list of elements that can be exported to Excel.

For example, in the project area we can generate a table where we can see the most important parameters and characteristics of each project. These lists can be customized (selecting the fields we want to see), filtered (selecting only a group of projects), or configured to have a specific number of rows in the report, and finally exported to Excel (to work with the information in a spreadsheet).


Customized reports

Customized reports are the most recommended in terms of flexibility and ability to analyze any ITM Platform data.

These reports can be managed from the Reports area of the Management menu of your ITM Platform environment. You can create your own reports by clicking Add new report.

Afterwards, the main element of the report must be selected, which will determine the information shown in the report. The main options are:

  • Projects
  • Services
  • Tasks
  • Purchases
  • Incomes
  • Hours report

Once you have selected the main element of your reports, click on the “Create new report” button.

On the next screen, you can create your report and preview it.

In order to create your report, select:

  • The fields you wish to include in the report: in order to do this, you have to drag the right column fields to the left.
  • The filters that you want to apply in the report, so that you can only see some specific elements.
  • The groups that you want to be applied: in order to do this, you have to drag the fields that the report includes to the first line where you can read the text “Drag the title of a column and drop it here to group it”.
  •  The order of the items shown can be modified for each report field.

Note:  Keep in mind that while you are creating the report, you cannot see all the data of it: It is only a preview. So even if you do not preview any data, the final report will present the final data.

Once configured, you can save the report in two different modes:

  • Private: it will be visible only to the creator of the report
  • Public: It will be visible to all users who can access the reporting area.

Later you can check your saved report as many times as you wish and the updated information will always be displayed in real time. The created reports can be edited by its creator or copied by any user who has access to it.


Predefined reports

Predefined reports were present in previous ITM Platform versions. The functionalities of these reports can be covered by the other types of reports. If you have any questions on how to do it, please contact support@itmplatform.com