Resource planning

Resource planning


Index


Introduction

The main purpose of the resource management area is to give full access users an integrated overview that combines:

  • all resources needed on projects and their underlying tasks
  • the capacity of those resources.

Since the two views can show conflicts between the demand asked for by project managers and the availability of resources, the resource management area also offers the project intelligence to address those problems:

  • Total demand needed for a project. You can drill down to each task and professional profile to see the detail you need.
  • Available capacity for each profile. You can drill down to individual resources.
  • Gaps between demand and allocated resources are marked in red for easy identification
  • Underallocations of a professional category or individual resource are marked in green, to identify resources with high availability


Resource planning for project managers

There are two ways project managers can assign team members to the project and its tasks:


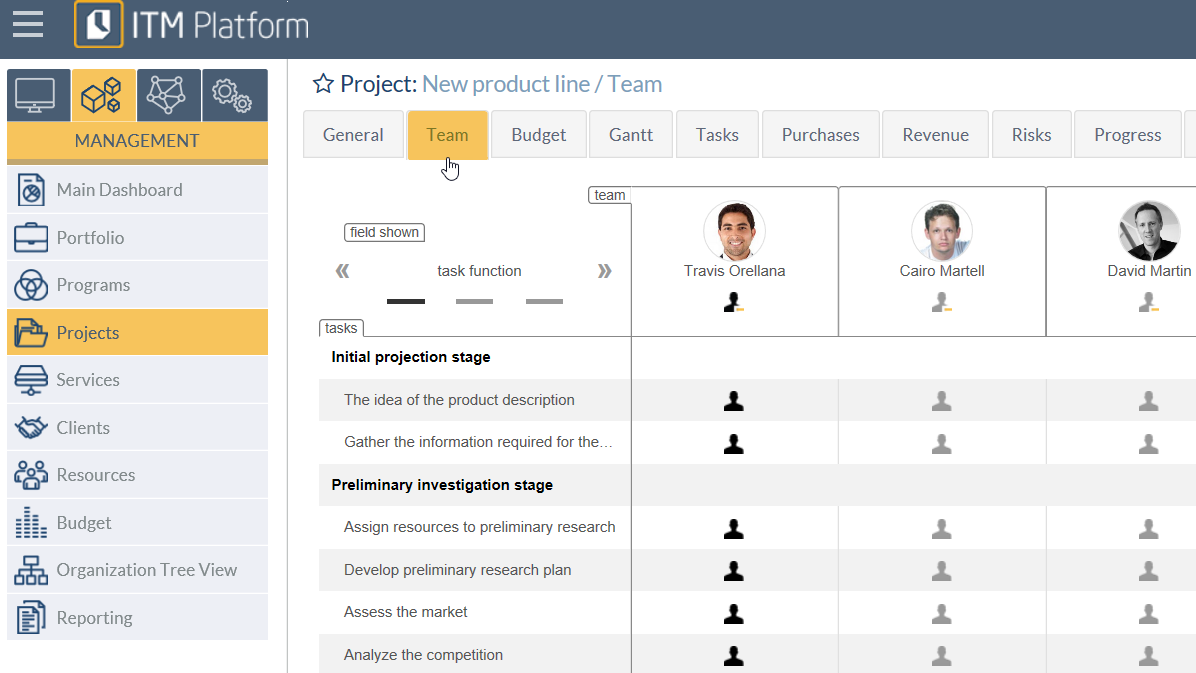
  • In the team control section of the project area
Team Control: Task function


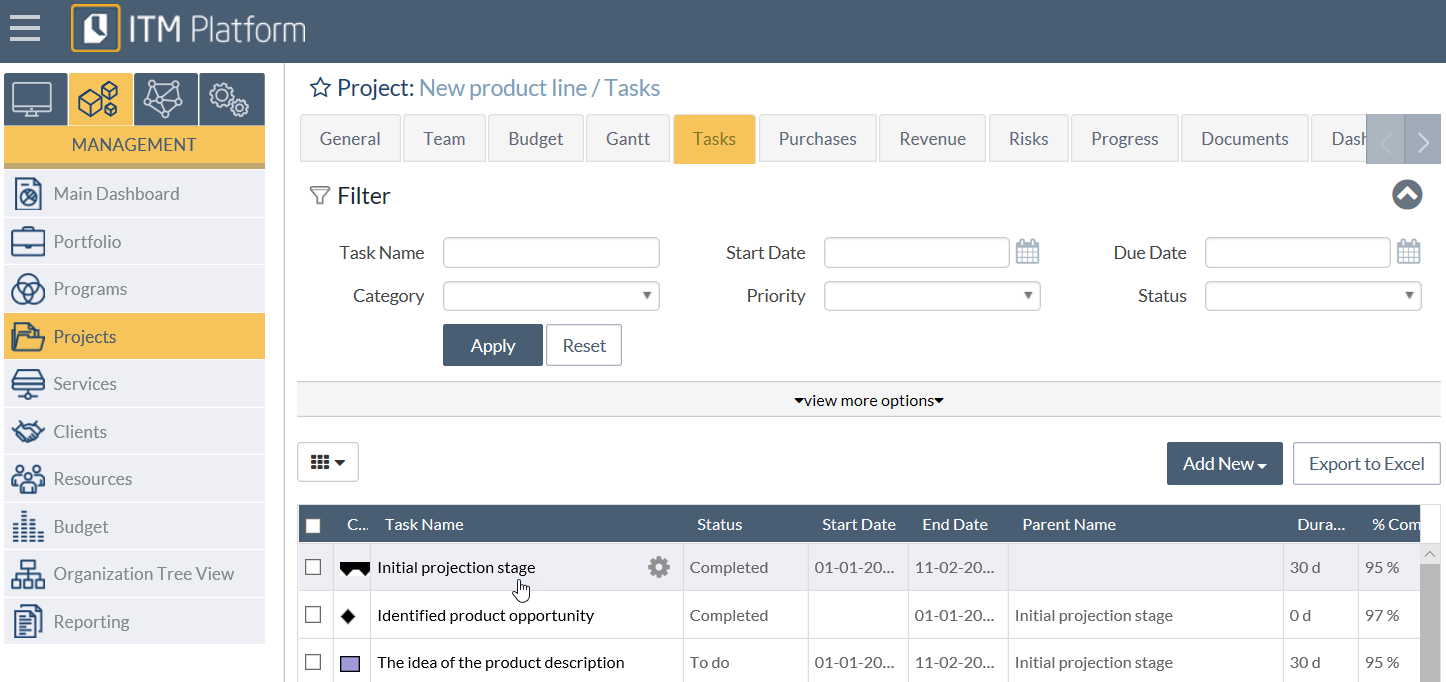
  • In the team section of a task, for each individual task.
Task Screen: Team assignments


Team control view

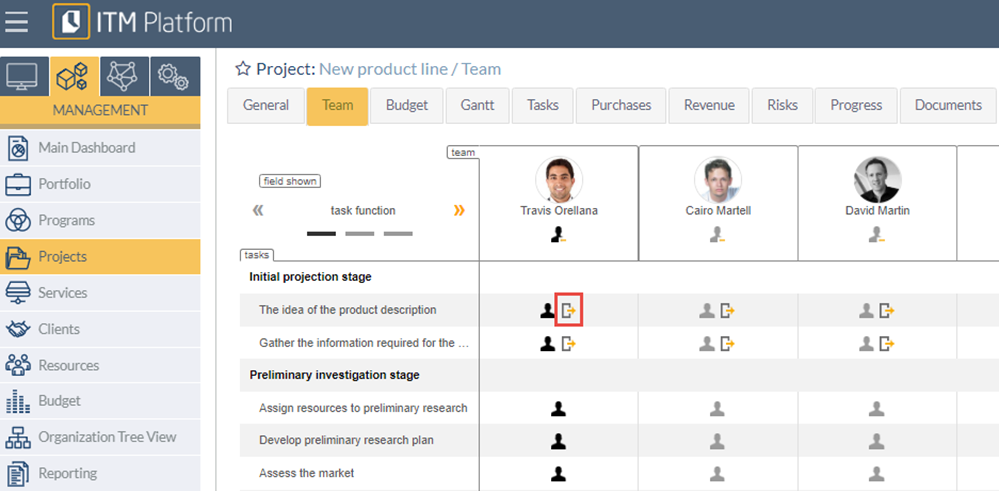
It can occur that a project manager assigns a task to a team member who is on holiday during the duration of the task.

To identify these cases, the sign   is shown next to the resource. This is shown for each individual task, since each task has its own duration.

Team control: Indications of holidays of team members

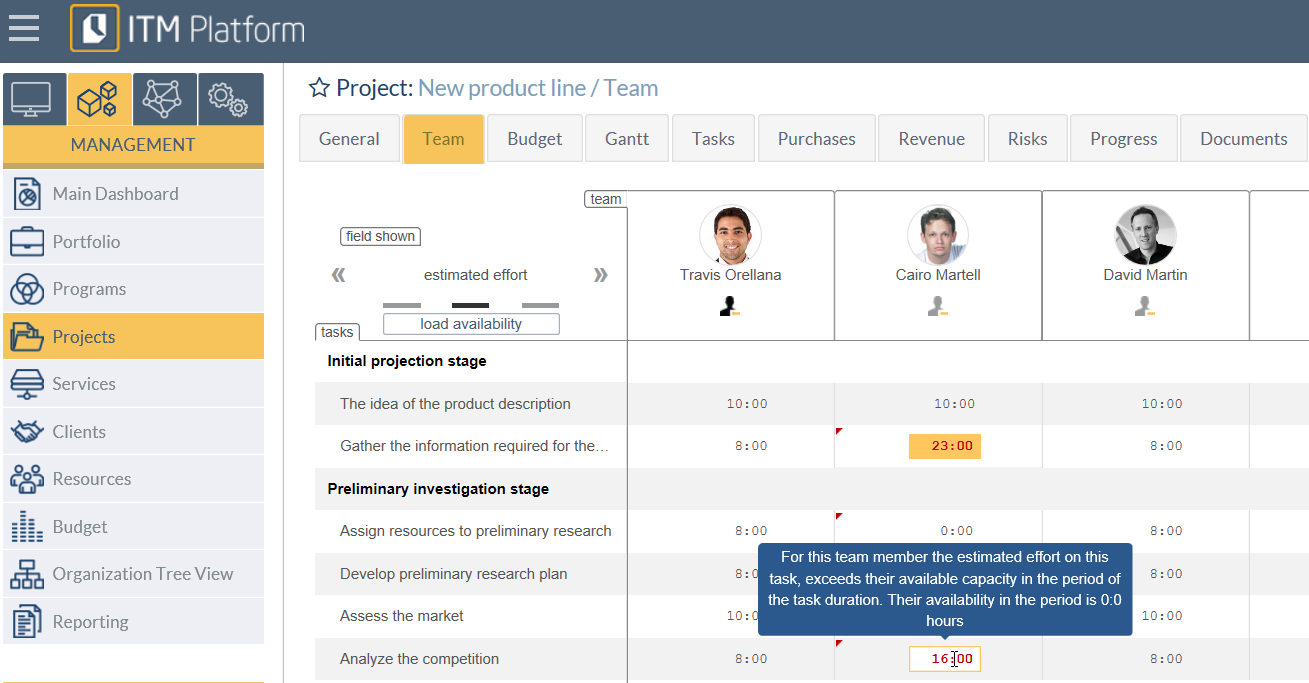
To see if the holidays of the team member cause any capacity problem for a task, the project manager can go to the estimated effort view of the team control. Any estimated effort marked in orange/red indicate an overallocation of the resource for that task. By hovering the mouse over the estimated effort, the project manager can check the exact available capacity in the period.

Team control: Indication of over assignments on tasks of team members

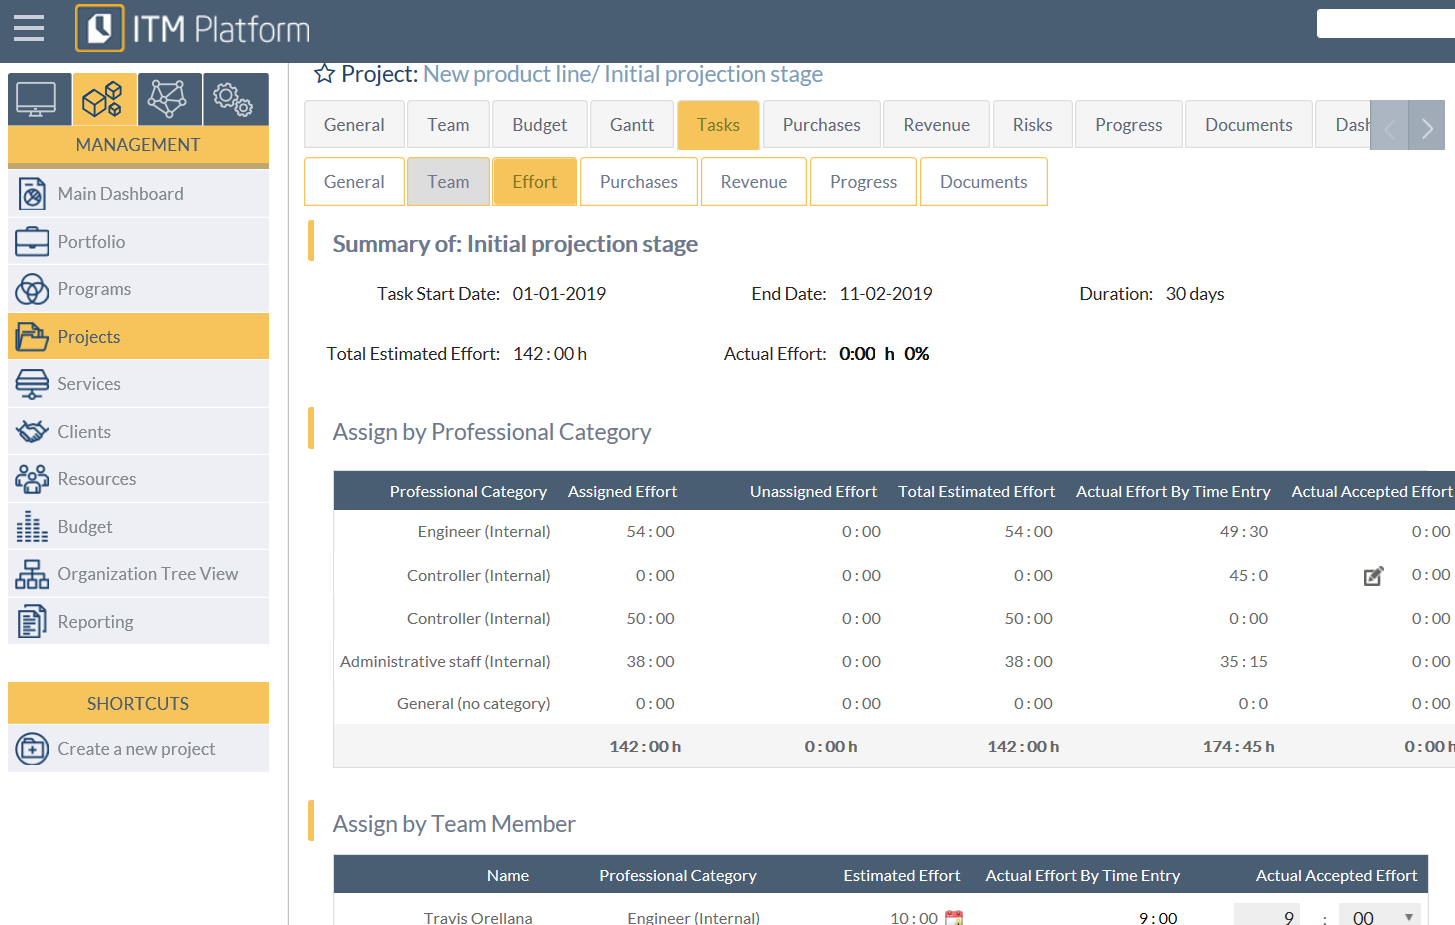
The team control is used to assign individual team members, but in certain cases instead of assigning individual resources, a project manager will want to plan the tasks by professional categories, for example by specifying the need for a senior analyst or technical architect. For this purpose, they use the effort subsection of a task.

In this screen, the upper section shows the assigned and unassigned effort for each professional category, while the lower section shows the estimated effort per assigned team member.

Task Screen: Efforts per professional category and team member


Resource planning for program and portfolio managers

While the above methods are enough for project managers, they lack an overview over all projects at the organization level. Whenever a team member is available to work full time on a task of one project manager, if another project manager is assigning the same team member on another task, a conflict may ensue.

Full access users, typically PMOs, program and portfolio managers, can leverage more powerful resource planning. To facilitate the resolution of these conflicts, the resource management area gives the full overview of demand and capacity over all projects:

  • The demand on a project or task represents the total effort planned by the project manager as in the team control section or task area, including both assigned and unassigned efforts
  • The capacity of a professional category and its underlying individual resources is the sum of their working hours in the period
  • The allocated hours are the sum of all estimated efforts already assigned by the project managers in the team control or task screen.

Note: The calculation of the capacity per professional category already takes into account the holidays of all individual resources.

The resource management screen is divided in three sections:

  • period selection/filter
  • demand section
  • resource allocation section

Note: The upper and lower level panel are designed to display the same period.

Note: By using the horizontal scroll bar, both panels will scroll horizontally. This allows you to always have an integrated view of the project demand and allocated resource capacity in the same period.


Selecting a period

The top of the screen includes the filters to set the range of the date you want to view on the resources screen. The demand and capacity can be viewed in four different intervals: day, week, month and quarter.

Note: The maximum number of intervals is 31 for days, weeks and months and 8 for quarters.

By selecting the start date  you set at which day the first interval should start. To apply these settings, click the Apply button.

The Underallocation % field  allows to set the threshold that will highlight in green the underallocation of resources in the below panel of the screen.

Example: If the total capacity of a resource in a period is 100 hours and 60 hours have been allocated, they will have a 40 percent underallocation. By setting the “Underallocation %” field to 35, the availability will be highlighted in green.

Finally, the field on the far right is used to set the number of rows you wish to display in each section.

Resource Management: Selection of period and filter


Demand Overview

Just below the header of the section in the first column, the percentage, total demand, total allocated and the total gap for the selected period are shown:

  • The percentage shows the amount of demand already allocated to resources
  • The total demand refers to the total number of hours needed in the period
  • The total allocated refers to the total number of hours allocated in the period
  • The total gap is the difference between total demand and total allocated in the period

The percentage above each period interval column  shows the amount of demand already allocated to resources in that interval. Within the column, demand, allocated hours and gap for each project, task and professional category are shown.

Resource Management: Column header with main indicators

When loading the resource management screen, most of the information is collapsed: the demand section shows all projects and services with demand in that period.

Note: The preceding icons C, K and S indicate a Waterfall Project, an Agile Project or a Service.

Demand Overview: View with projects collapsed

Each project can be expanded by clicking the preceding arrow, which will drill the project down to the underlying tasks. By clicking the arrow that precedes the task, you will further drill down to see each professional category that is needed/assigned to the task.

Demand Overview: Expanded project 


Projects or tasks that have a gap, meaning that the number of allocated hours is less than the demand, are marked in red numbers with a light orange background when the gap is less than 10 hours, or in red numbers with a dark yellow background when the gap is more than 10 hours.

Demand Overview: Gaps


There are various methods to resolve gaps:

  • Go to the professional category (or categories) that cause the gap and assign more hours of already assigned resources. See the Resource Allocation paragraph of this article for more detail. In the demand section, you can click on the professional category with the gap to jump to that professional category in the resource allocation section.
  • Reduce demand. As the demand was determined by the project manager you may want to agree it with them.
  • Change the duration of the task. This can be done in the menu in the pop-up for the task.
  • Add additional resources of the same professional categories. You can do this by clicking on the tools wheel right to the task and then click on add resources. When you add a resource to as task, it will show in the resource allocation section with 0 hours, where you can assign the corresponding hours. If needed, the system will add the necessary professional category to the task.

Note: The team member needs to be assigned to the project if you want to assign him to a task.

Trick: Assign the team member to a project quickly by clicking on the tools wheel right to the project.

Assign resources through project settings


Trick: When a team member has been assigned to the project, you can assign him to the task with the corresponding tools wheel

Assign resources through task settings


Resource allocation

As with the demand section, the resource allocation view is collapsed by default. It shows all resources that have allocated hours in the period, grouped by their professional categories.

Resource allocation section: Project details


The resource allocation section only shows resources that have assigned hours in the selected period. If you add a resource to a task from the demand section, it will show in the resource allocation with 0 hours in each column.

Note: If you save the screen without assigning hours to a resource just added, it will disappear from the resource allocation section.

Trick: Add a placeholder hour estimation to keep the resource. We recommend adding just 1 hour.

The resource allocation section shows the following information:

  • Capacity: The total number of hours that either all assigned resources of a professional category or an individual team member are available, based on their working hours and calendar in the period
  • Allocated: The total number of hours that all assigned resources of a professional category or an individual team member have been assigned to a project or individual task
  • Availability: The difference between the capacity and allocated hours. If it is marked in yellow/red , it indicates an overallocation of the professional category or individual team member. A green highlight  indicates an underallocation with the threshold that is set in the filter.

When expanded, the above information can be seen at four different levels:

  • The total of all assigned resources of a professional category
  • The total of all hours of an individual team member on all the projects they are assigned to 
  • The total of all hours on an individual project for an individual team member
  • An individual task for an individual team member 

Note: The only field that can be edited is the allocation of an individual task of an individual team member.

Note: Capacity values cannot be edited, as they depend on the working hours and calendar of a resource.

Note: The availability cannot be edited either, as it’s a calculated value.

When you increase the number of allocated hours of a resource, two things can happen regarding the corresponding demand:

  • The total demand for the corresponding category for the task exceeds the total allocation. As a result, the overall gap on project demand will decrease. Example: The demand on the task is 4:00 h. The assigned effort is 1:00 h (so the gap is 3:00 h). If we increase the allocated hours from 1:00 to 3:00 the gap will decrease and will be 1:00 h.
  • The total demand for the corresponding category for the task is less than the total allocation: the demand will be increased to make the gap exactly zero. Example: The demand on the task is 4:00, and the assigned effort is 1:00 (so the gap is 3:00 h). If we increase the allocated hours from 1:00 to 5:00 the gap will decrease and will be 0:00 h.
Resource allocation section

Importing and updating purchases with a CSV file

Introduction

In ITM Platform, you can manage purchases within any project. Purchases can be created and processed manually. Part of this process can be done either by importing a CSV file which contains updated information in one or more purchases. This CSV file could, for example, be exported from your company’s accounting or ERP system.

The principal use of this functionality is to update existing purchases in ITM Platform once you have paid the purchase invoices. The process can also be used to add new purchases to ITM Platform. Given that the scope of this process are paid invoices, purchases will automatically be set to a status that has an actual value (such as “Paid” or “Completed”).

The import process is carried out in an individual project. If you require to update purchases on several projects, you need to repeat the process for each project.

Configuration

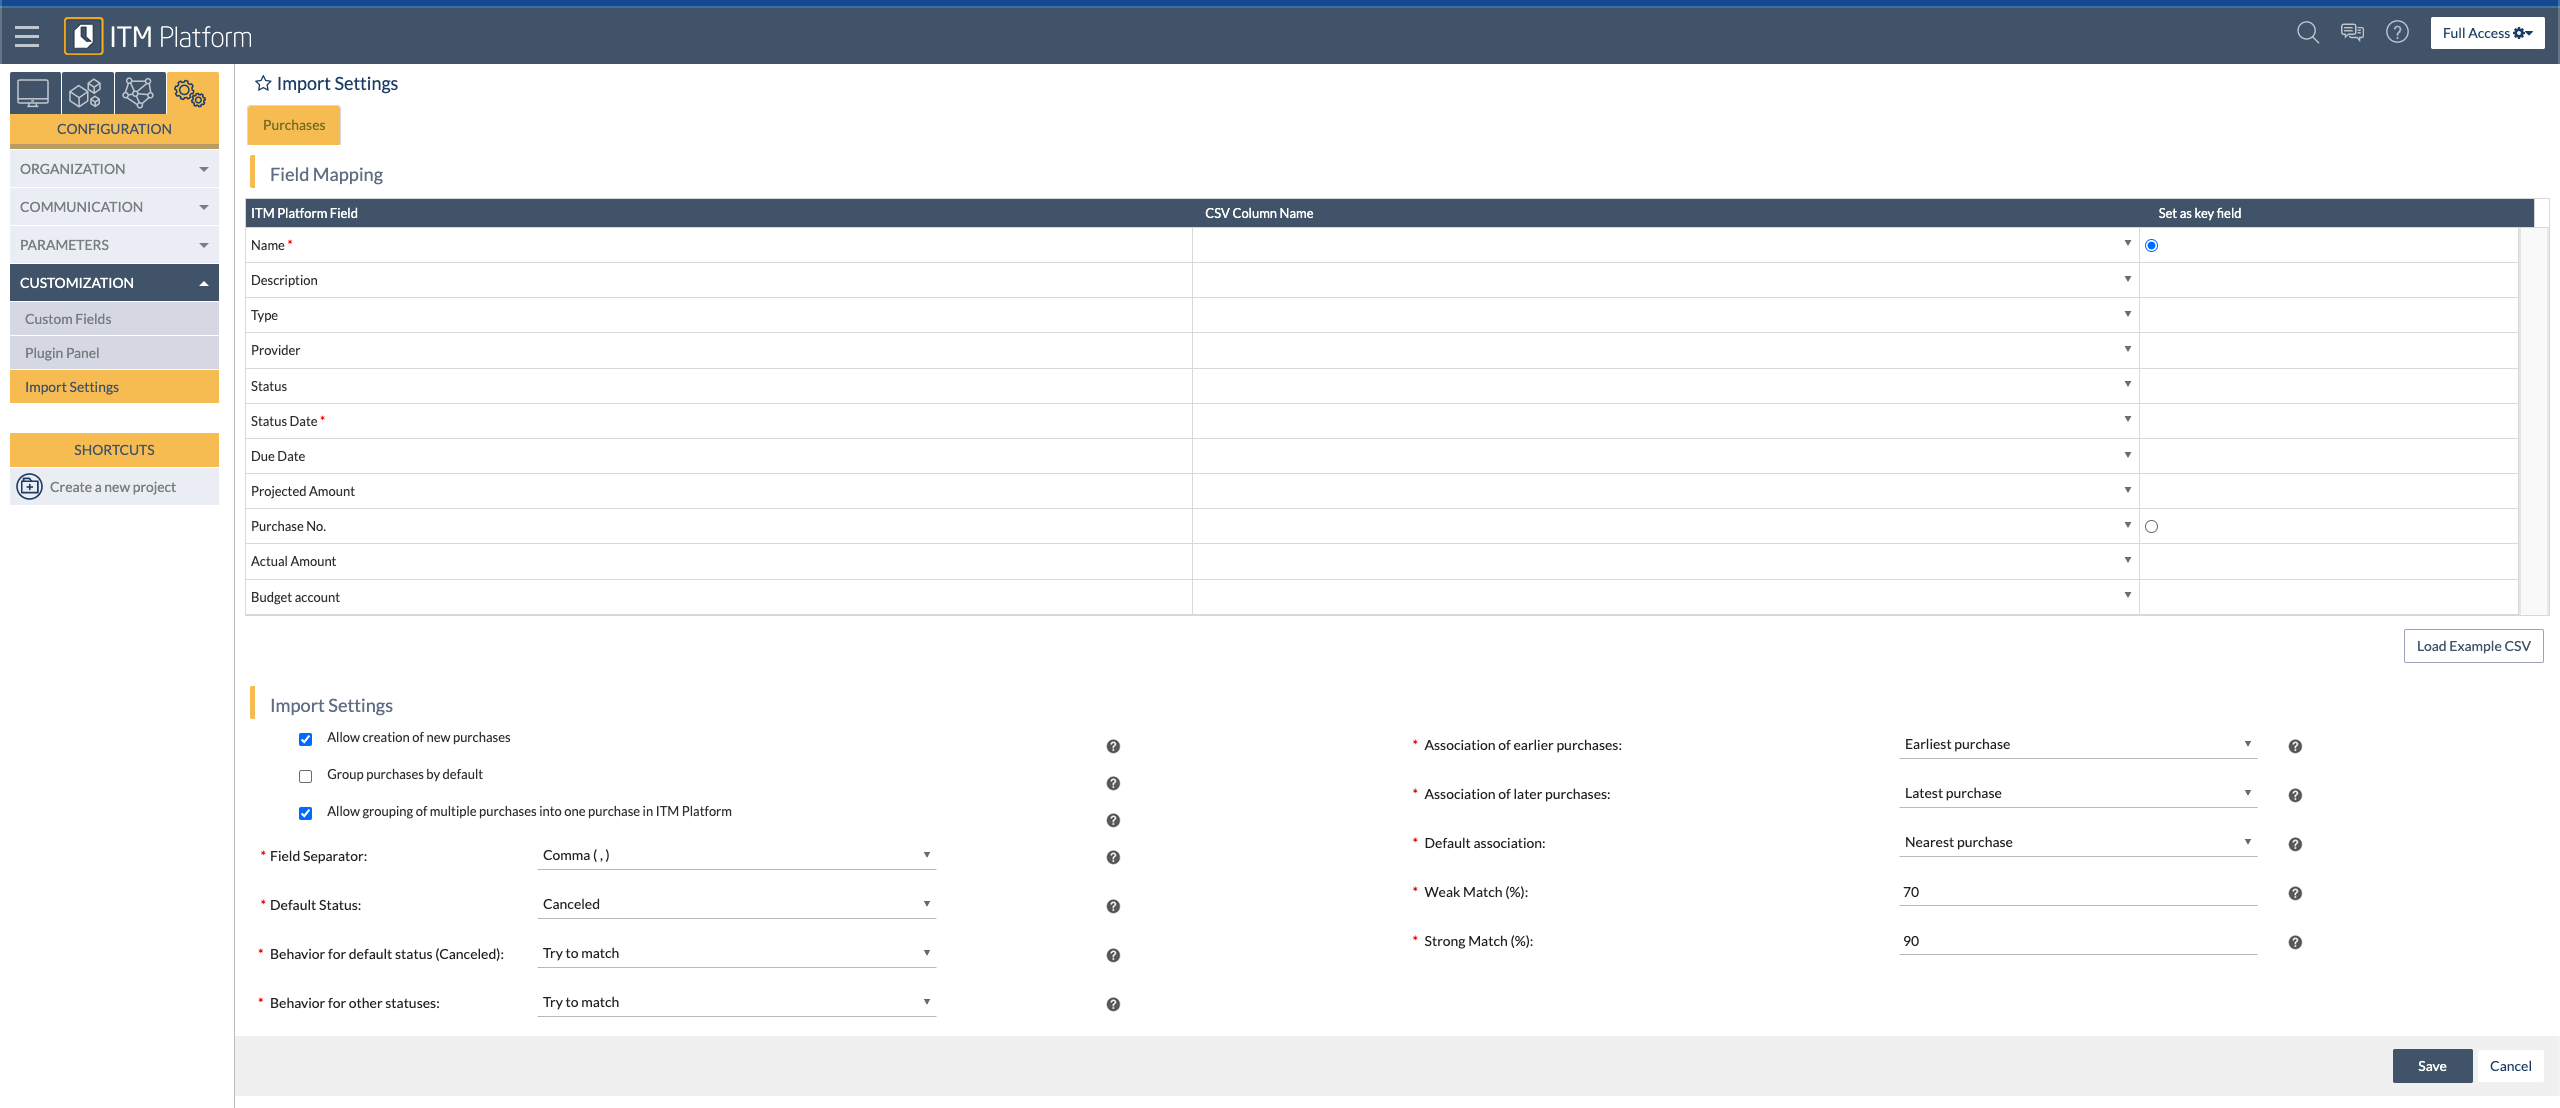
Before using the import process  for the first time, we need to configure the mapping of fields between the CSV file and ITM Platform. This section requires Full Access permissions and can be found under the name “Import” in “Customization” in the “Configuration” tab. The easiest is to upload an example file, of which ITM Platform will read the column names. In the section below,  you can match the CSV column name to its corresponding field in ITM Platform. For example… … All fields are optional except “Name”, “Status Date” and “Actual Amount”.

In the configuration screen above, additional options are provided:

  • Set as key field: required to select which field will be used to set the relation between each row in the CSV file and the purchase in ITM Platform. You can choose between “Name” or “Purchase No.”
  • Allow creation of new purchases: enable this option if you want to allow for the creation of new purchases from the CSV file (as described, more in detail in “Creating new Purchases”).
  • Allow grouping of multiple purchases into one purchase in ITM Platform: enable this option if you want the grouping of multiple purchases from the CSV file into one purchase in ITM Platform (as described, more in detail in ¨Grouping of purchases¨).
  • Field Separator: select which character will be used as the default field separator in the CSV file, choosing between comma (,) and semicolon (;). This setting can at each import be overwritten.
  • Actual Value: when updating or adding purchases to ITM Platform from the CSV file, these will automatically be set to a status with an actual value. If in the purchases parameters your company has multiple purchase statuses with an actual value, you can select the status to which purchases should be set in this setting.
  • Association of earlier purchases: ITM Platform tries to match the purchases from your CSV file with an existing purchase in ITM Platform. In this setting you can set what should be done if the status date of the imported purchase is earlier than the due date(s) of the matching purchase(s) in ITM Platform. The available options are to link it to the purchase in ITM Platform with the earliest date, with the latest date or create a new purchase.
  • Association of later purchases: In this setting you can set what should be done if the status date of the imported purchase is later than the due date(s) of the matching purchase(s) in ITM Platform. The available options are to link it to the purchase in ITM Platform with the earliest date, with the latest date or create a new purchase.
  • Default association: In this setting you can set what should be done if the status date of the imported purchase falls between the due dates of the matching purchases in ITM Platform. The available options are to link it to the purchase in ITM Platform with the earliest date, with the latest date, with the nearest date or create a new purchase.
  • Weak Match: The match is based on the extent to which the names of the purchases in your CSV file and ITM Platform coincide. In this setting you can determine the minimum percentage of coincidence for a match to be considered weak.
  • Strong Match: The match is based on the extent to which the names of the purchases in your CSV file and ITM Platform coincide. In this setting you can determine the minimum percentage of coincidence for a match to be considered strong.

* Please note that these settings apply to all projects and for all users in your organization.


Updating existing purchases

The process is initiated by clicking the button “Import from CSV file” within the Manage Purchases section of a project.

This opens a pop-up window where you are asked to select your CSV file. At this stage you can also change the field separator of your CSV file (comma or semicolon).

If we encounter any issues, normally related with the syntax/format of the file, you will receive an error message.

Upon clicking “Save” we will analyze your CSV file and make a proposal on how to update the purchases. In the screen below, you can make any necessary changes.

  • On the left side of the screen, you will see fields drawn from the CSV file (fields with a grey background).
  • On the right side of the screen, you will see fields corresponding to purchases in ITM Platform with their respective values. Any changes made will be applied to all fields.
  • In the center of the screen, you will findthe column “Match Type”, which shows you the type of matches that were found between the purchases from your CSV file and ITM Platform.
    • Based on the purchase names in your CSV file, a strong match means there is  a strong correlation to another purchase name found in ITM Platform.
    • Based on the purchase names in your CSV file, a weak match means there is a weak correlation to another purchase name found in ITM Platform.
    • New Entry means there is no correlation and the creation of new purchases from the CSV file is allowed therefore a  new purchase will be created.
    • No match means there is no correlation and the creation of new purchases from the CSV file is not allowed. In order to continue, you will either need to remove this purchase from the list or manually select a purchase from ITM Platform.
    • Manually selected means that you have to manually set the relation with a purchase in ITM Platform.
  • In the column “Name”, we show the purchase that will be updated in ITM Platform. For easy identification, we show its due date in brackets.
  • For existing purchases, the budget account that is shown, cannot be changed.
  • By clicking on the button next to the purchase name, a pop-up window opens and allows you to change the purchase that will be updated.
  • The fields “Description”, “Purchase No.”, “Actual Amount”, “Projected Amount” and “Status Date” can be changed manually, by simply writing in the desired field. The field “Type” can be changed by selecting an existing value from the dropdown menu.
  • You can (optionally) include a provider name or purchase type, that will be included in the purchase only if we find a matching value in ITM Platform.
  • The provider can be changed by clicking on the button next to it, and in return, opens a pop-up where you can either select an existing provider or create a new one.
  • You can also select or change the task of which a purchase depends.
  • The column “Group” displays which group a purchase pertains to. ( For more info, see  section ¨Grouping of purchases¨).
  • The x” in the final column allows the user to exclude individual purchases from the import process.

After you have reviewed the import summary and made your changes, if any, click “Confirm” to submit the changes. If there are any issues with the import, you will be notified via a pop-up screen and the changes will not be applied until you have fixed the issues.

Grouping of purchases

The grouping of purchases allows the user to group two or more purchases from the CSV  file into one corresponding purchase in ITM Platform. This means that the information from two or more purchases from the CSV file is combined and used to update one purchase in ITM Platform:

  • The status date that is set, is the one closest to the due date of the corresponding purchase in ITM Platform.
  • For the actual amount to be set in ITM Platform, we sum the amounts of the individual purchases of the CSV file.
  • To add or update the rest of the information in ITM Platform, we use the data of the purchase of the CSV file that has the status date that is closest to the due date of the purchase in ITM Platform.
  • The column “Group” lists  which group a purchase belongs to.

If ITM Platform has found a match with an existing purchase but you would rather create a new purchase in ITM Platform, you can click on the icon next to the purchase name. In the pop-up that opens, click on “Create New Purchase” and instead a new purchase will be created.


Groups are automatically proposed based on the names we find in the CSV file. If you do not agree with the proposal that ITM Platform makes, you can remove the purchase from the group. Click on the icon next to the purchase name and in the pop-up that opens, click on “Remove from Group”.

To add purchases to a group, you can manually change the linked purchase in ITM Platform. If an  ITM Platform purchase is already linked to one or more other CSV purchases, a group is created or extended.

To remove purchases from a group, you can manually change the linked purchase in ITM Platform. By doing so, it will automatically remove the purchase from its corresponding group. Please note that by clicking on “x”, the purchases are entirely excluded from the import, not just from the group.

Grouping of purchases can be done for both existing and new purchases.

Grouping of purchases can only be done if the corresponding setting in the import configuration screen has been enabled.

Creating new purchases

The process of creating new purchases is similar to that of updating existing purchases. Existing and new purchases can be mixed in one CSV file.

If ITM Platform does not detect a match between the purchase in your CSV file and ITM Platform, it proposes to create a new one. This can be identified by the value “New Entry” in the column “Match Type.” Some specific characteristics of creating new purchases are:

  • Select a budget account for each individual new purchase, by selecting it from the dropdown.
  • • ITM Platform will use the purchase name provided in the CSV file and it cannot be changed
  • You can (optionally) include a provider name or purchase type, that will be included in the purchase only if we find a matching value in ITM Platform
  • If you include multiple entries of the same purchase in your CSV file, they will automatically be grouped (if grouping is enabled)
  • You can manually select an existing purchase from ITM Platform. By doing so, an existing purchase will be updated instead of creating a new one.


Import History

Click “Import from CSV file” within the Manage Purchases section of the  project and from the dropdown menu select the option “View Import History”.

This opens a pop-up window where you see a history of all performed imports, along with  its date, number of records and user.

By clicking on a row, you open the full detail of the import.

Requirements for formatting the CSV file

Please format your CSV file by taking the following requirements into account:

  • The first row should include the column names.
  • All columns should be separated with a comma, other separators are not supported.
  • Values can optionally be put inside quotes “”. This is necessary if, for example, you need to include commas for amounts or within a name.
  • The amount and date formats should coincide with the company settings in ITM Platform.
  • The file should be encoded in Unicode UTF-8.

How to deactivate and reactivate projects or services

How to deactivate and reactivate projects or services

Projects or services cannot be permanently deleted in order to preserve the integrity of the portfolio set (resources, hours, purchases, etc.). However, they can be deactivated so that they are not listed on the project list.

To deactivate a project (for services follow the same instructions), go to the “Projects” section from the “Management” section of the Main Menu.

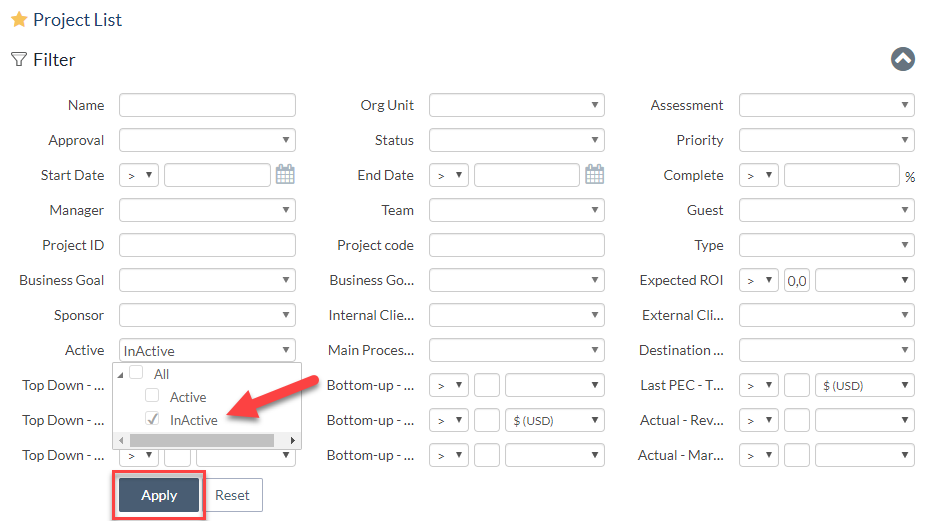
You can view deactivated projects by modifying the filter:

To activate a project again, go to the last column and click on the “green” arrow:

You will finally need to reset the filter or modify the filter for active projects.

Expected progress of summary tasks and projects

Expected progress of summary tasks and projects

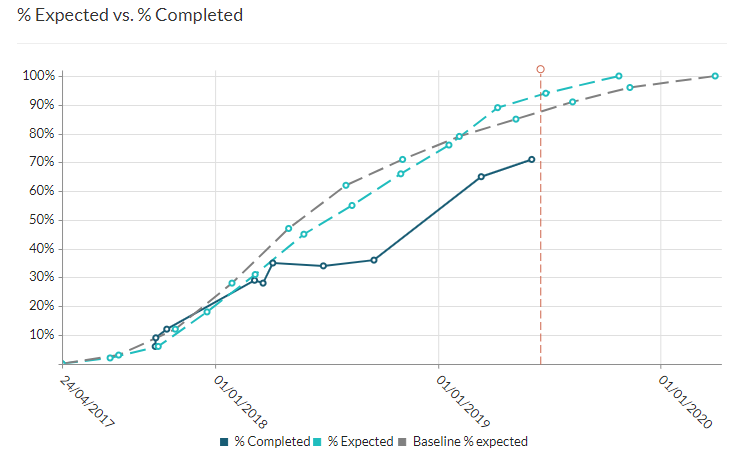
The expected progress calculation is made assuming that, up until present time, all tasks are completed in the same percentage as time has elapsed since its inception. On that basis, the expected percentage will calculate the progress of summary tasks and projects in the same way that it is done with the calculated progress.

For example, if a task lasts 10 days and today’s date is on the seventh day, the system will take a 60% expected progress for that task (6 days elapsed/10 days total).

Once all tasks have been calculated, the expected percentage for summary tasks and for projects will accumulate, resulting in the expected % of both.

ITM Platform will take into account the default calendar and weekends for calculating expected progress, just as they are used in the calculation of tasks duration.


Expected progress of the baseline

If you have an active baseline, the expected progress will be calculated for both the ongoing planning and baseline, counterposing both the project tracking curve.


How reliable is the expected progress?

The calculation is a temporary projection and therefore does not necessarily represent the expected real progress of the project, unless the actual progress of the tasks is proportional to the time.

In other words, real productivity is not necessarily linked to the elapsed time. The project or task manager reports on the actual progress and not on the progress of time. This may be reason why the expected % may differ from what has been done.

Example: You have a task to lay bricks for 10 days, however, more bricks are stacked in the first couple days than the last. The Task Manager is aware of this and at the end of the third day reports a progress of 40% (there are 40% of the bricks). However, the expected progress will not reflect reality, because the calculation is 30% (3 days elapsed/10 days total)


Tracking progress of tasks and Waterfall projects (Gantt)

Tracking progress of tasks and Waterfall projects (Gantt)

ITM Platform gives you the tools to report and monitor the progress of tasks in a project. Task progress will be used to compute the calculated progress of summary tasks and the project’s total progress.

Before continuing, let’s define two similar but not equal concepts:

  • Progress of a task, a summary, or a project (also referred to as percentage completed) is a percentage that represents the actual progress ratio. Thus, 0% will indicate that it has not been started, and, in general, 100% indicates it has been completed. You can mark tasks and projects as completed without reaching 100%.
  • Progress report of tasks and projects offers additional information. It includes an assessment (configurable values list), a description, the percentage completed (progress), and a progress report date.

The progress value represents its real progress and is generally reported by the task manager or the project manager.

The progress of the task is not caclulated by the actual consumption of estimated hours. The hours invested in the task do not necessarily represent the actual progress of the task.

Who can report the progress of a task?

Usually, it is the task manager or the project manager, although users with Full Access permission can make changes without necessarily having to be assigned to the project.

Where can you report progress on tasks?

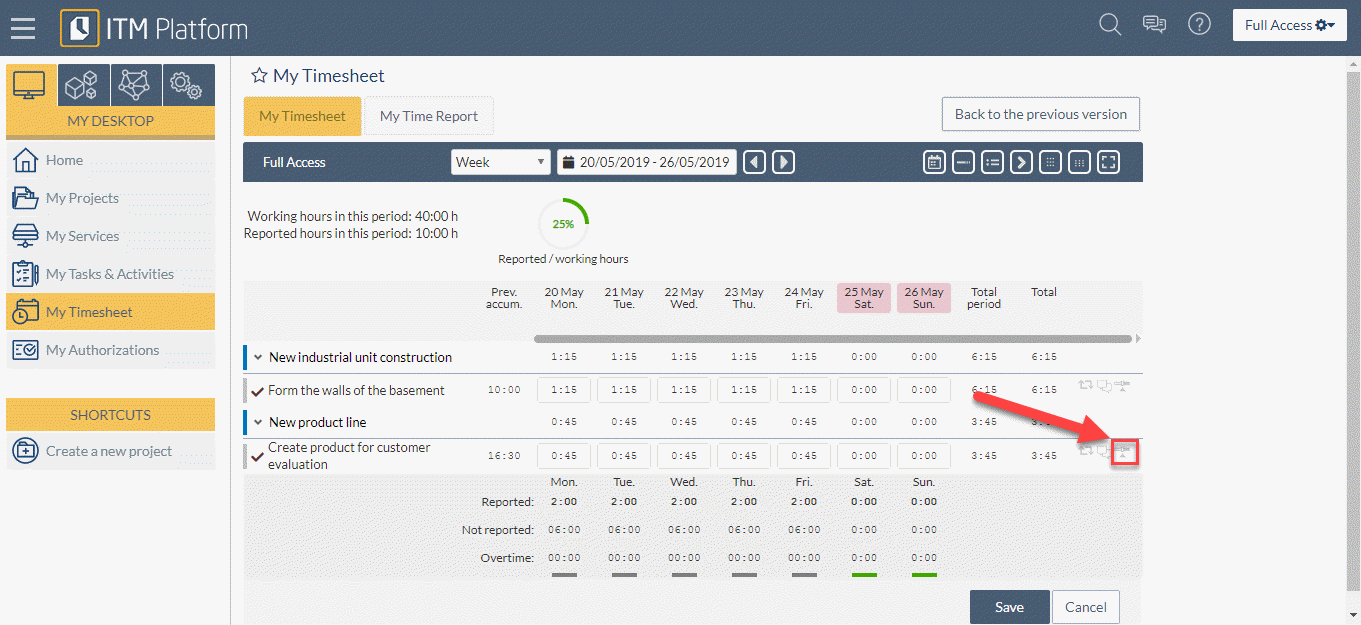
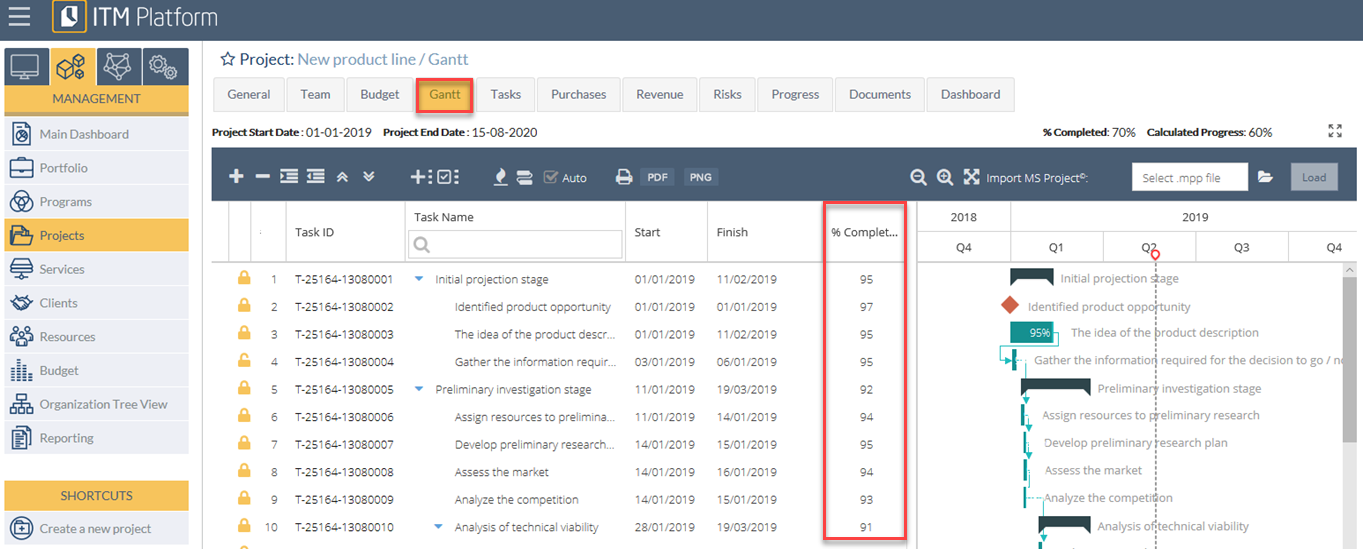
There are three places from which a user can report progress: Timesheet, Task Tracking section, and the Gantt.

It is possible to track in an automated way from another application using the API.

Tracking from the timesheet

Task managers will see a “progress” icon on the timesheet that will allow them to create a progress report.

Tracking from the “Task” tab

The tasks have several sections of information, one of them being “Progress”, where you will see a tracking history as well as the possibility of adding a new one.

Progress report by changing the task status

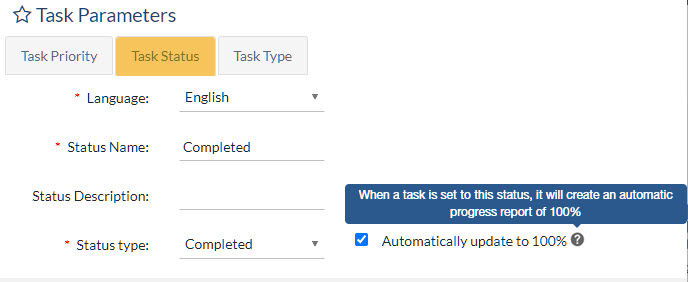
When you move a task to a completed type of status, you can configure the system so that progress is increased to 100%, generating automatic progress report.

To configure this behavior in waterfall projects (Gantt), access the SETTINGS menu > PARAMETERS > Task Parameters > Task Status. When selecting “Status Type”, tick the “Automatically update to 100%” check box

Thereafter, the tasks you mark as completed will be assigned 100% progress.

Note that if you roll back the status to a “Pending” or “In Progress” type, you will need to manually assign the new progress, if desired.

Progress Report from the Gantt chart

In the Gantt chart, there is a “% Completed” column that can be edited by the project manager.

When saving, a progress report will automatically be generated for each task. Progress of summary tasks will be updated following the calculated progress method configured in the project. If the option is checked, a project progress report will also be created.

Progress Report section

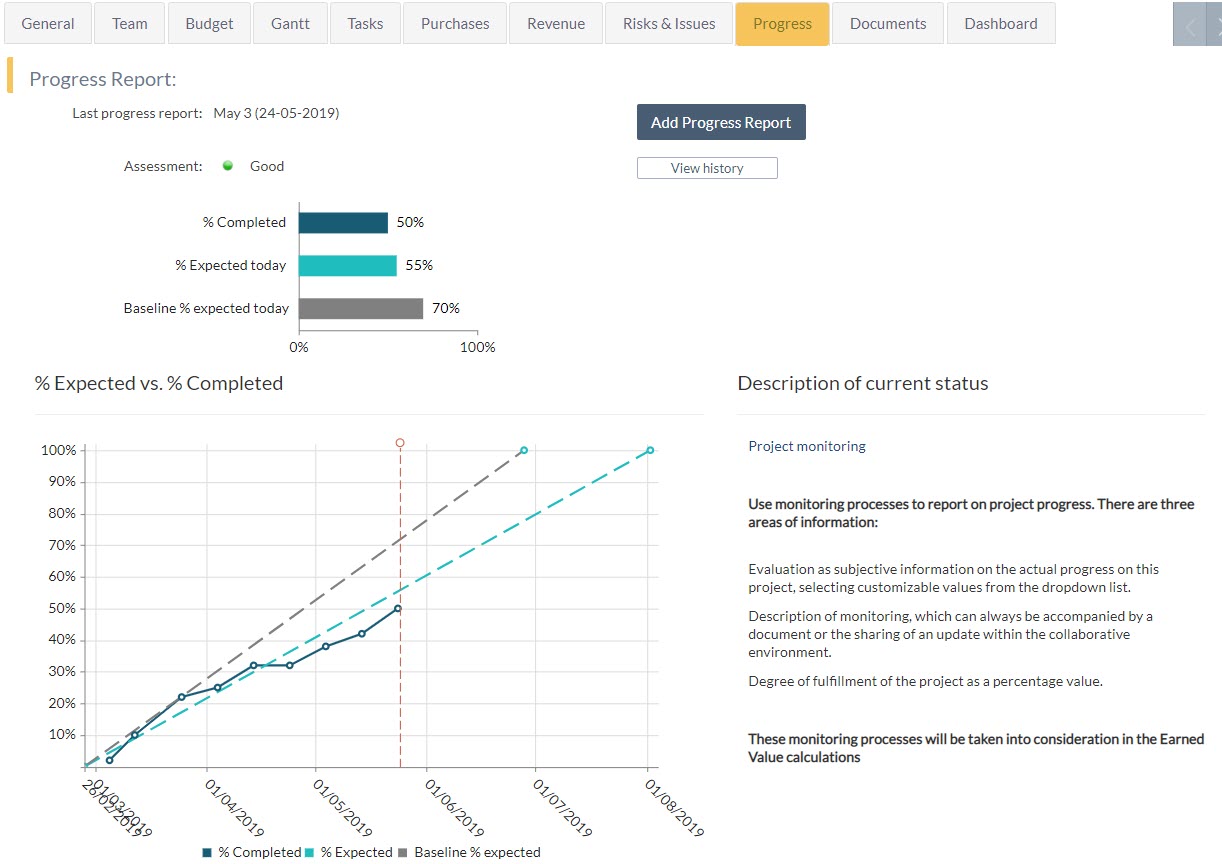
In the Progress section of the project, you will have access to the following metrics:

  • % Completed: represents the progress created by the project manager, either manually or automatically.
  • % Expected today: represents the progress that the project should have reached today, based on its duration.
  • Baseline – % expected: represents the progress you would expect from the active baseline.
If you did not set a baseline, this data will not be reflected in any of the charts.

In this section you will also find:

  •  “Add a progress report” button, the option to report progress manually
  • “View History” button, that allows you to access previous progress reports
  • “Description of current status” section shows last report description
  • The “Earned Value” button will show you the project’s Earned value analysis


Other related articles in the Project and Task tracking section.