Grant permissions to create baselines

Permissions to manage baselines

Users having Full Access or Project Manager license-based roles can create, set as active, and delete baselines.

By default, roles based on those licenses will have the permission granted. If you want to revoke or grant it again, go to ORGANIZATION, USER MANAGEMENT, Role Definition and select the role you wish to change.

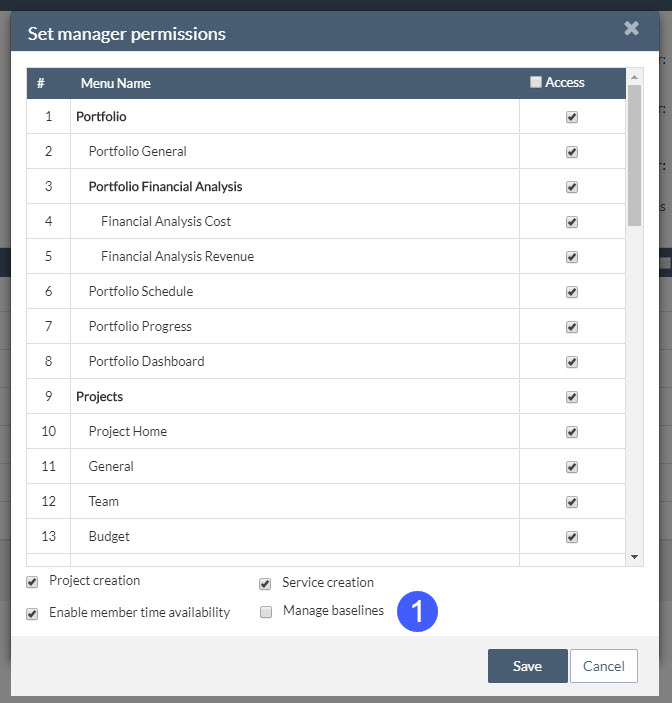
Click on “Set manager permissions” and select or deselect “Manage baselines”

Project baselines

Project baselines

Baselines allow you to set control points in planning, which may be compared to the current situation of the project.

ITM Platform allows you to establish as many baselines as you want, being able to have one of them active (active baseline), which will be the one that compares with the current situation.

When you set a baseline, different types of project information are saved: schedule, effort in hours, costs, and revenue.

  • Schedule
    • Start and end dates of the project.
    • Start and end dates of all tasks.
  • Hours:
    • Budgeted hours (for internal, external, and undefined teams).
    • Estimated hours.
  • Costs:
    • Budgeted and estimated cost of hours.
    • Projected amounts of purchases and their dates.
    • Amounts of budget accounts.
  • Income: expected amounts and their dates

Set a new baseline

New baselines can be created from the General, Budget, and Gantt sections (in case of waterfall projects). From any of these locations, the baseline will record the full project information.

In order to establish new baselines, you need to have the necessary permissions assigned to your user role.

  • From the General section, click on the “Manage Baselines” button and click on the “Create new baseline” button.
  • From the Budget section, click on the button “Create new baseline.”
  • From the Gantt, click on the button “Create new baseline.”

In all cases you will be asked for the name of the baseline, proposing by default one sequential to the previous—if one already existed—and offering the possibility to establish it as an active baseline.

Set an active baseline

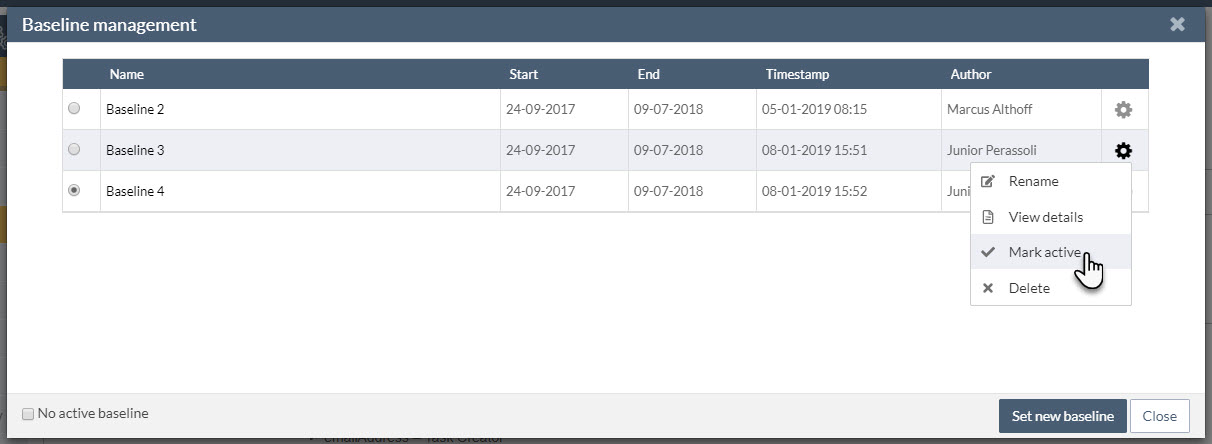
You can set an existing baseline as active from the General section of the project, clicking on the “Manage Baselines” button. Select the existing baseline and click the option-button on the left, or click on the option-gear on the right and select “Mark as active.”

You can also uncheck the active baseline and leave the project without any.

Access baseline data

Baseline information is accessible in the same places where the current situation of the project is located, so that it can easily be compared.

  • General section of the project
  • Budget
  • Gantt
  • Project lists and task lists
  • Reports
  • API

The names of the baseline fields are identifiable by their homonyms of the current situation, because they add to the same name the word “baseline.”

Using parameters in API calls from Excel cells (named ranges)

Using parameters in API calls from Excel cells (named ranges)

We have seen how to create graphs and reports calling the ITM Platform API from Power Query for Excel. With these techniques, you can extract and shape all the necessary information, but we needed to be able to customize calls to the API with parameters to – for example – send the user name and password, or filter results.

In this article we will explain how to do it through cells, or “named ranges” in Excel. The basic idea is to set up the worksheet to allow the user to enter data that will be later used by Power Query in the call to the ITM Platform API.
These are the steps:

1. Give a name to each cell

Cells (or ranges) in Excel can have a name. It will be the reference that we’ll use later in Power Query
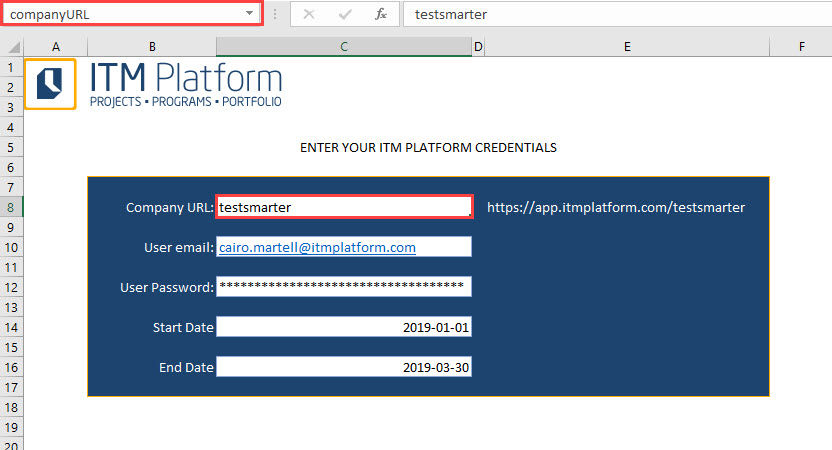
In the example, we have named companyURL (in the picture), email, password, datein and dateout.

Tip: so the password is not visible directly in the cell, we set the custom format **;**;**;** Please note that this is not a secure way of storing passwords. Hiding and protecting the worksheet will help, but the password will still be accessible

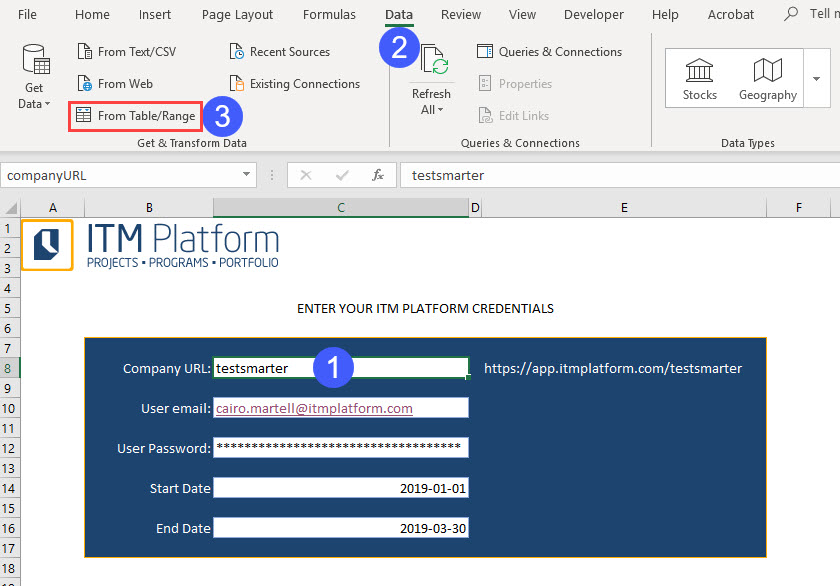
2. Perform a query from a table or range

For each field of data (each cell) entry, we create a query “from a table or range” in the “Data” menu
3. Remove the two last steps

When you create the query, a pop-up window will display three steps created automatically. We will remove the last two
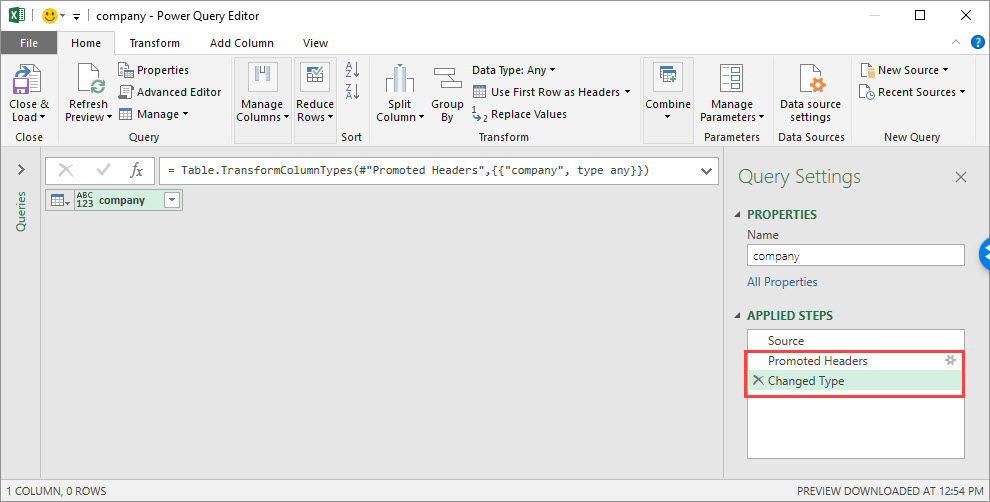
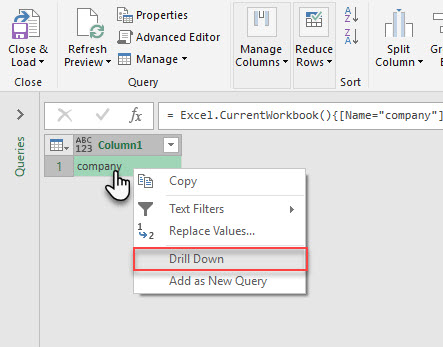
4. Right click on the value of the field and select “Drill down”
5. Close and load as “only connection”

Go to Home and select “Close and load to…” as “only create connection”.
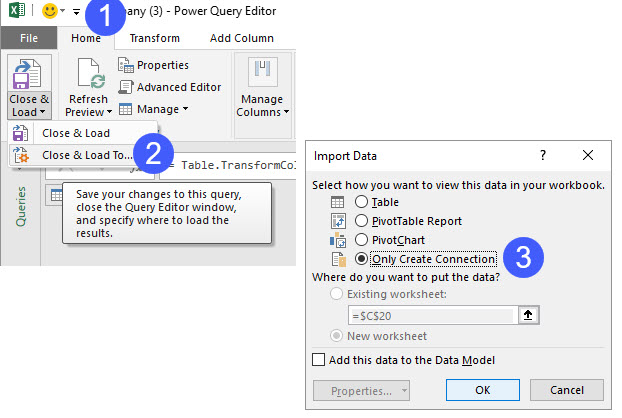
This will create a parameter (“companyURL“) that we can use in queries to the ITM Platform API, simply using its name.

6. Use the parameters

Now it’s just a matter of using the parameters in queries, linking these with the text t. In this example, we are using the companyURL, email and password parameters to obtain the connection token.

myToken = Json.Document(Web.Contents("https://api.itmplatform.com/" & companyURL & "/login/" & email & "/" & password))


Important note: as it happens in articles of previous examples, you have to select “always ignore privacy levels” in Excel’s options section.
 

Cost of the estimated hours

Cost of the estimated hours.


To have a cost estimation for projects and services, ITM Platform allows you to establish the cost per professional profile, used to calculate the estimated budget for a given task or project.

Professional profiles accept ranges of values. For example – A “Junior Engineer” as an employee (in-house) can have assigned a cost of $30/hr from 1 – 15 January, and then $35/hr from 16 January onwards. To estimate the cost for a task to be completed between 1 –30 January, the system will automatically multiply the assigned hours by the hourly rate, for each day. For example:

  • Task: Draw a Turbine
  • Junior Engineer Assigned: Cairo Martell
  • Total hours spent: 80hr
  • Hour distribution: Uniform, 4hr/day, 20 days
       - 1-15 January: 20hr
       - 16-30 January: 20hr
  • Hourly cost of this task:
       - 1-15 January: 20hr x $30/hr = $600
       - 16-30 January: 20hr x $35/hr = $700
           Total cost of this task = $1,300
  • Purchases for this task: $2,000
       - Total cost of this task: $3,300

To be able to perform the calculations aforementioned, each task should have a defined starting and ending date. Therefore, one would be able to determine which hourly rate should apply, based on the professional profile. Since ITM Platform allows for tasks to have neither of the two dates, the calculations will be done according to:

  • If both starting and ending dates are provided, the previous methodology will be applied, calculating the hourly cost every day.
  • If only either the starting or ending date is provided, the hourly rate of the current day will be applied on the total hours spent in a given task.
  • If neither date is provided, the standard cost at the calculation time and date will be applied on the total hours spent in a given task.

The aforementioned will also be applied to provider rates.

The calculations for estimated hour cost can be found in project list (task-list), services, tasks and activities, details in the Commitment section of each task, budget section of a given project or service, tables, P&L reports and API methods.

Other related articles: Resource Planning.

Reporting hours

Reporting hours

There are various ways to report hours in ITM Platform:

  1. Through the timesheet
  2. Through the task list
  3. Through Slack

Alternatively, it is also possible to integrate a third-party system with ITM Platform’s time report through the API (Integration Interface). This is useful when an organization already uses another system, but wants to analyze effort and cost information from within ITM Platform.

Timesheet

It contains all tasks and activities assigned to a user during a given period, and allows reporting of hours per day, adding comments for each time entry and, if you are responsible for the task or activity, you can also add a progress report.

This module offers a series of visual information aids that allow the user to have better control over it and be more productive.

Period Control

In a predetermined way, the timesheet offers a weekly view, although a different range of between 1 and 30 days can be chosen.

Control bar

Contains actions that facilitate the visualization of tasks and periods.

Shows or hides, at the bottom, all comments made during the period
   Shows or hides non-working days. If shown, these are always marked in a distinctive color
   Displays one or more rows for task names. If you only display one line and the text exceeds this length, hovering the mouse pointer over will show the full name
   Shows or hides completed tasks
   Deploys or collapses projects or services, showing or hiding work items
   Shows or hides the accumulated calculations. The left-hand accumulated summary sums up the hours before the period, and the right-hand adds to the latter the current period
   Shows or hides the header, where a summary of the reported and working hours of the period is shown
   Maximizes or maintains a fixed size for the timesheet

Reporting hours and commenting

When you click on one of the available boxes to enter data, you can perform two different actions: enter hours and enter comments. A red corner indicates that hours have been entered, but not yet recorded, and a comment symbol will indicate a comment on that day for that work item.

A button will give you the option to write or edit an existing comment. These comments will not be visible by the rest of the team, only by the person who introduced it, and the project manager.

Actions per task

On the right hand side of the timesheet, a number of options are offered which affect the entire task.

   Allows you to mass enter hours that will be repeated for that work item throughout the period shown
   Add a comment in the work item, which will be shared in the panel with all the members of that task team
   If you are responsible for the work item, you can add progress report.

 Footer

At the bottom you will find a summary per day of the hours reported, compared with the working hours of each day.

A color coding shows a difference of +-20% over the daily working hours, gray indicates that they have not been reached, and red that they have been exceeded.

All reviews of the period

If you choose on the control bar to show all comments made in the period, they will be displayed at the bottom of the screen, grouped by date or by work item, as you have opted with the pivot button.

Project managers and portfolio managers will be able to access all comments from the “time” report type.

Report from the Task list

Reporting hours from the task list, allows you to not only enter hours, but also the start and end time.

It also allows you to report the same hours to a range of dates, in case you do the same routine all those days.