Weekly workload
The Weekly tab of the Resources section shows one week at a time. For each person it lists the projects and services they work on, with the estimated effort and the actual time of every day, and compares the total with their capacity. Use it to check who is overloaded or available this week and whether people are reporting the time that was planned.
To open it, go to MANAGEMENT > Resources and click Weekly.
From this view you can:
- Move between weeks or jump to the week of any date.
- See, for each person and day, estimated effort and actual time per project or service.
- Spot overallocated people, vacation days and company holidays.
- Filter by people and org unit, or limit the view to the projects you manage.
- Open a person's day-by-day chart, or a project's Team tab to change the assignments.
- Export the week to Excel.
The Weekly tab is read-only. Access, the projects-you-manage scope, colors and export are shared with the Analysis tab and described in Resources section.
The Weekly tab at a glance
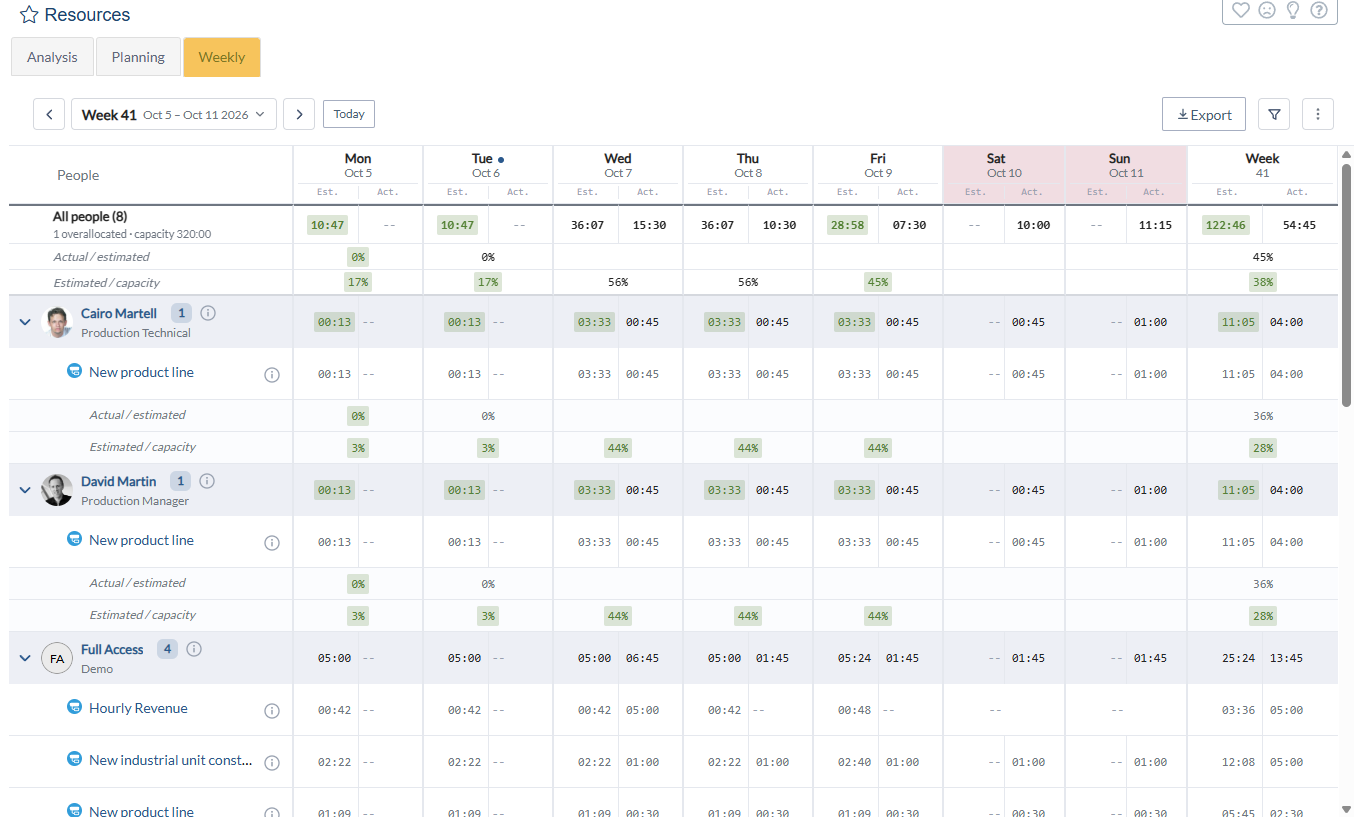
- Header: the previous and next week arrows, the week label with its number and dates, Today, and on the right Export, the filter icon and the three-dot menu. The filter icon shows how many filters are active.
- Columns: one per day, each split into Est. and Act., then Week with the week totals. Columns follow the first day of the week set in your profile or, if you have none, in the account. The week number is the ISO week number.
- Summary: the All people row stays at the top while you scroll. It shows the number of people, how many are overallocated and their total capacity, the daily totals, and the Actual / estimated and Estimated / capacity ratios for everyone.
- People: each person is a band with photo or initials, name, position, the number of projects and services in view, an information icon and, when needed, the overallocation triangle. Under the band come one row per project or service, an Other work row when there is any, and the two ratio rows. Everyone is expanded when the page opens; click the arrow on the left to collapse a person.
Choosing the week
- Use the arrows to move one week back or forward, and Today to return to the current week.
- Click the week label to open Go to the week of and pick any date; the view moves to the week that contains it.
- The page remembers the last week you looked at, your filters and your view options in this browser, and opens there next time.
Filtering people and projects
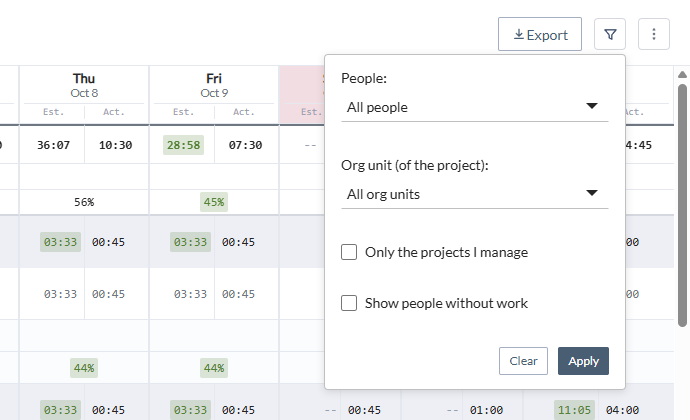
Click the filter icon to open the filters:
- People: one or more people. Type to search.
- Org unit (of the project): shows only work on projects and services of the selected org units, and the people who have work there.
- Only the projects I manage: limits the view to the teams of the projects and services you manage; their work elsewhere becomes Other work. Project Managers always see this scope. See Projects you manage and Other work.
- Show people without work: also lists people with nothing estimated or reported in the week, which helps find who is free.
Click Apply to load the week with the filters, or Clear to remove them.
If nobody has estimated or reported time in the week, the page says so and offers Show people without work. When more than 500 people match, the page lists the first 500 and asks you to narrow the filters.
View options
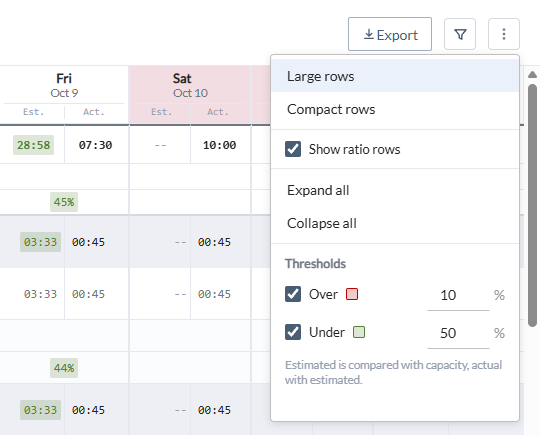
The three-dot menu holds:
- Large rows and Compact rows.
- Show ratio rows, to show or hide the Actual / estimated and Estimated / capacity rows.
- Expand all and Collapse all.
- Thresholds: Over, 10% by default, and Under, 50% by default. The under threshold is higher than in Analysis because, in a week that is still running, most figures are below their reference.
Reading a week
- Estimated is the estimated effort that falls on that day for the person on each project or service.
- Actual is the time they reported in the timesheet for that day.
- The Week column adds up the seven days.
- Other work shows estimated effort only. Its actual time is not shown.
- Actual / estimated is computed on the projects and services in view. Estimated / capacity includes Other work, so it reflects the person's whole load.
- Days that have not finished carry no color for actual time. Today shows its numbers without color, and later days show
--.
Weekends and company holidays have a tinted heading. A company holiday is also outlined and named in the line above the grid.
A vacation day carries an umbrella in place of the actual value, and in the Estimated / capacity row. Hover it to see the date and any work still estimated that day.
Overallocated people and day by day
An orange triangle next to a name means that, on at least one day of the week, the person's estimated effort is above their capacity. Every minute counts, including work estimated on a weekend or vacation day, which have no capacity. Hover the triangle to see on how many days and by how many hours. The triangle tells you that there is an overallocation somewhere in the week; the red color on a number tells you where and by how much.
Click the information icon next to the person to see their position, capacity this week, estimated, actual, the two ratios, Other work and the days overallocated.
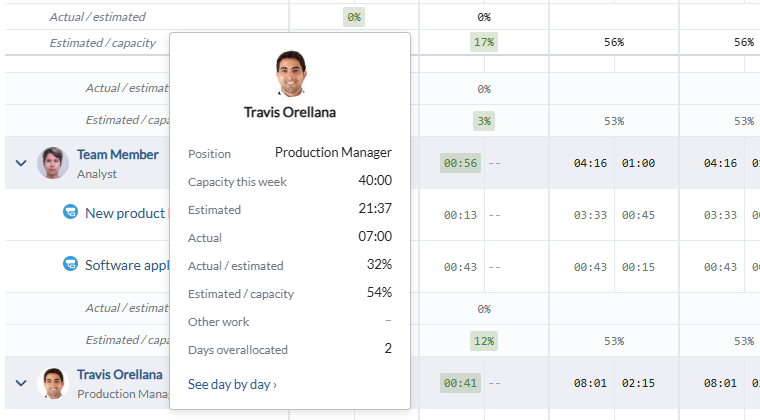
Click See day by day to open the person's chart for the week. Each bar is a day: estimated effort in this view and Other work are stacked against the day's capacity, overallocated days are marked, and non-working and vacation days are labeled. The number under each bar is estimated / actual. It is the same reading as the Daily workload panel of the project Team tab, narrowed to this week.
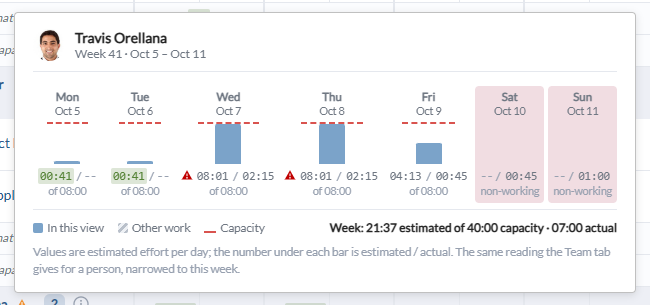
To resolve an overallocation, click the information icon of a project and then Open its team, available for the projects you manage. In the Team tab you can reassign tasks or redistribute estimated effort. See Project team management.
Exporting the week
Click Export to download the week as an Excel file. It has one row per person, project or service and Other work, the estimated and actual hours of each day, the week totals with capacity and the two ratios, and a Filters sheet. See Exporting to Excel.
FAQ
Why does a person have the triangle but no red number? The triangle appears as soon as the estimated effort exceeds capacity by any amount on any day, including a weekend or vacation day. The red color appears only when the excess reaches the Over threshold.
Why are the actual cells of later days showing --?
Those days have not happened yet. Actual time is judged only on finished days.
Why is the Estimated / capacity cell empty on some days? Weekends, company holidays and vacation days have no capacity, so the ratio cannot be computed.
Can I change an assignment from the Weekly tab? No. Open the project's information panel and click Open its team to change assignments in the Team tab.
Why does my week start on Sunday? The Weekly tab follows the first day of the week set in your user profile or, if you have none, in the account settings.
Why don't I see some people? By default, the tab lists people with estimated or reported time in the week. Select Show people without work in the filters to include the others. Project Managers only see the teams of the projects they manage.